Disclaimer: The opinions expressed in this article are my own and do not represent the views of Google. This content is based solely on publicly available information.This content is for educational and entertainment purposes only. The author is not a financial advisor, and the content within does not constitute financial advice. All investment strategies and financial decisions involve risk. Readers should conduct their own research or consult a certified financial professional before making any financial decisions.
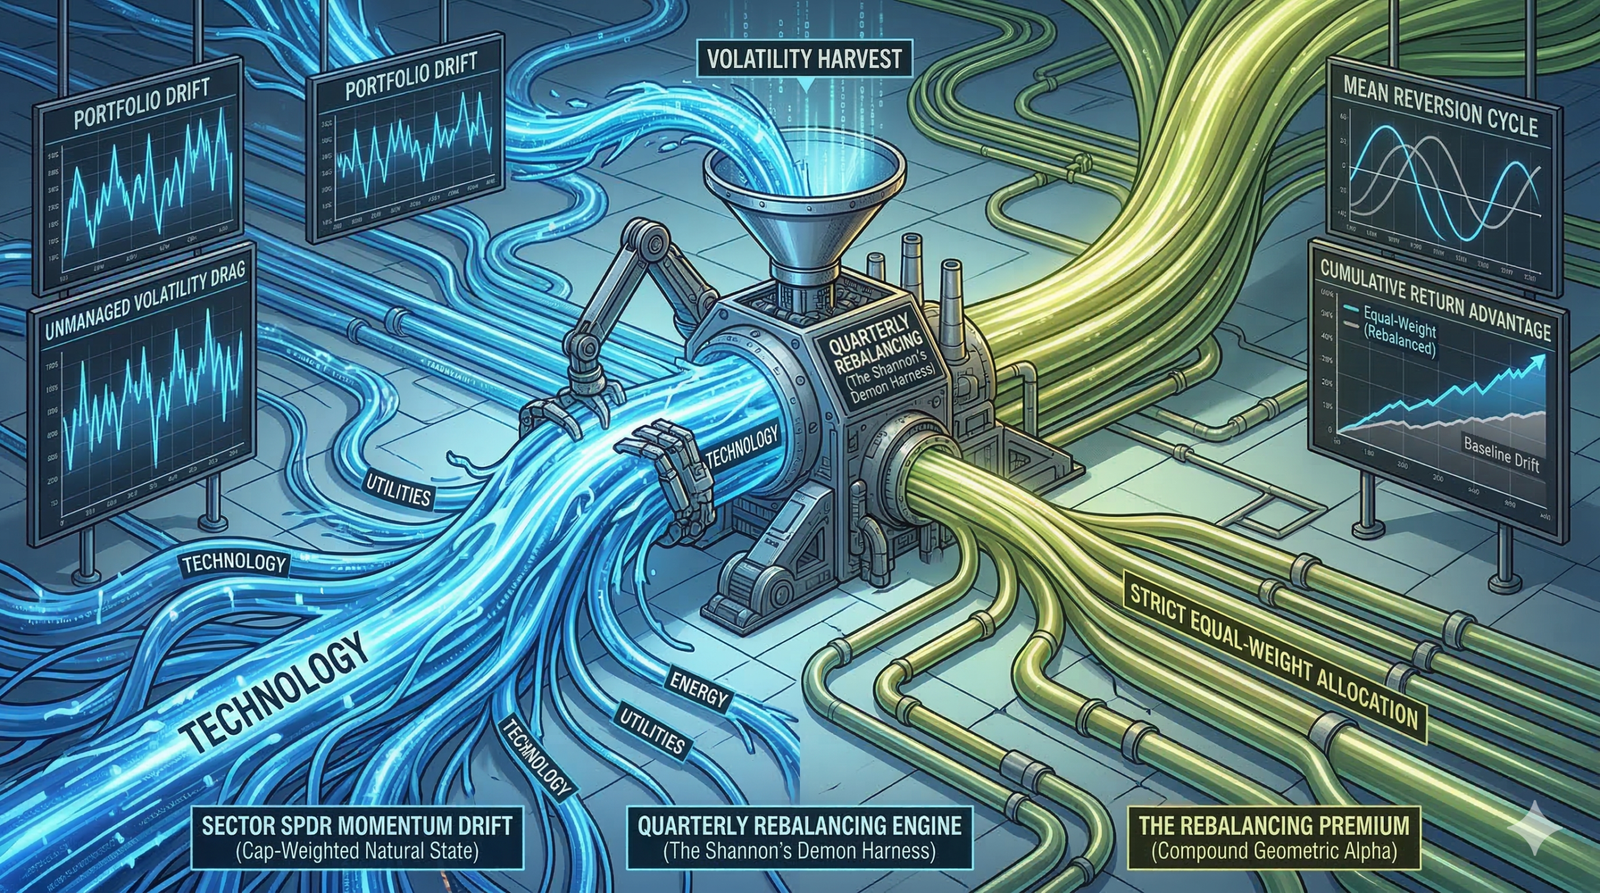
When you pick up a cap-weighted index fund, you’re basically letting the market itself decide how your money gets spread out, since the fund just follows whatever companies are getting the most love from investors at any given time. So, as big tech companies keep growing and their prices shoot up, your fund quietly buys more and more of them, which means you end up riding the wave of whatever is already popular, almost like you’re following a momentum strategy without even trying.
An equal-weight index fund takes a completely different approach, because instead of letting the biggest companies take over, it keeps things balanced by making sure each company gets the same slice of the pie. To do this, the fund has to stick to a simple rule: every few months, it sells a bit of whatever has gone up the most and uses that money to buy more of whatever has fallen behind. In a way, it’s like having a system that always nudges you to buy what’s out of favor and sell what’s gotten a little too popular, so you end up following the classic advice of buying low and selling high, but without having to second-guess yourself or get caught up in the latest market drama.
A lot of financial advisors will tell you that this kind of rebalancing is just about managing risk, but that only tells part of the story. What’s really happening is that, by regularly shifting money from the winners to the laggards, the fund actually creates a unique source of returns that goes beyond just spreading out your bets. This extra boost, sometimes called the ‘Rebalancing Premium,’ comes from the simple act of buying what’s down and selling what’s up, which takes advantage of the natural ups and downs in the market.
If we look at what happens when you let a portfolio drift wherever the market takes it, compared to one that keeps getting pulled back to an even balance, we can actually see how much of the returns come just from this rebalancing process. By setting aside the overall market movement, we can figure out exactly how much value is added by simply going against the crowd and letting the natural tendency for things to even out—what people call mean reversion—do its work.
The mechanics of quarterly rebalancing
Before we can really talk about what the rebalancing premium is, it helps to start with a simple baseline: imagine you set up an equal-weight portfolio today and then just leave it alone, thinking it will stay balanced, but as soon as the market opens the next day, that balance quietly slips away.
As soon as trading begins, prices start to move and the weights of each stock in your portfolio shift around, almost like they have a mind of their own; the companies that are doing well pull more of your money toward them, while the ones that are struggling quietly shrink into the background, and if you just let this play out for a while, your carefully balanced portfolio slowly morphs into something that looks a lot more like a regular market-weighted portfolio, simply because the winners keep getting bigger and the losers keep getting smaller—this slow drift is what we use as our starting point, since it shows us what happens if we just let the assets do their thing without any interference.
But a real equal-weight index fund doesn’t just sit back and watch this drift happen; instead, it steps in every quarter to pull everything back to the original balance, almost like hitting a reset button four times a year to make sure no single stock gets too far ahead or falls too far behind.
To see how this works in practice, picture a really simple case with just two stocks, each making up half your portfolio; if one of them suddenly doubles in price while the other just sits there, your portfolio is now lopsided, with most of your money in the winner, so rebalancing means selling some of the high-flyer and using that cash to buy more of the laggard, bringing both back to an even split.
This back-and-forth is really where the magic of rebalancing comes from, because by selling some of the stock that just had a big run and buying more of the one that’s been left behind, you’re not just locking in gains and picking up bargains; if these two stocks tend to bounce around but eventually come back toward the same general trend, this simple act of regularly selling high and buying low actually helps your whole portfolio grow faster than if you just held on and did nothing.
So instead of just riding along with whatever growth each company delivers, you’re actually taking advantage of the ups and downs between them, turning their back-and-forth swings into extra returns for yourself.
The reason this works comes down to the difference between what you might expect from just averaging returns and what actually happens when you let gains and losses pile up over time; if you simply buy and hold, big swings in price can really hurt you, because losing half your money means you need to double it just to get back to where you started, so the more your investments bounce around, the harder it is for your portfolio to keep up with the average return you see on paper.
By sticking to this regular rebalancing routine, you’re actually helping your portfolio sidestep some of the damage that wild price swings can cause; when you take profits from a stock that just shot up and use them to buy more of the one that’s lagging, you’re not only buying low and selling high, but you’re also making sure that no single stock can drag your whole portfolio down if it suddenly reverses, and over time, this steady approach can quietly boost your returns, almost like you’re squeezing a little extra growth out of the natural ups and downs of the market.
Shannon’s demon and the mathematics of volatility harvesting
Claude Shannon, who is best known for inventing information theory, came up with a really interesting idea: what if you could actually use volatility itself to generate returns, even if the underlying asset doesn’t go anywhere in the long run? He imagined a simple setup where you have a perfectly balanced portfolio made up of just two things: a wildly volatile stock that, over time, doesn’t actually gain or lose value (it just bounces up and down), and plain old cash. If you just buy that rollercoaster stock and hold on, you end up right where you started, since all those ups and downs cancel each other out over time. And of course, if you just sit in cash, you also get nothing.
But here’s where things get a little weird, because if you set up a rule to always keep your portfolio split 50/50 between the stock and the cash—constantly rebalancing whenever one side gets out of whack—the math starts to do something that feels almost like magic: suddenly, your portfolio starts to grow, even though neither piece is making money on its own.
Think about what happens when the stock price drops by half: suddenly, it makes up less than half your portfolio, so your rule tells you to take some cash and buy more of the beaten-down stock. Then, when the stock bounces back up to where it started, it now takes up more than half the portfolio, so you sell some of it and put the profits back into cash. By sticking to this simple rule—always buying more when the stock is down and selling some when it’s up—you end up making money purely from the way the price bounces around, even though the stock itself isn’t actually creating any value over time.
This little trick is known as Shannon’s Demon, and it shows that if you mix together assets that bounce around in different ways and keep rebalancing them, you can actually end up with a portfolio that grows faster than the average of its parts. That extra growth is sometimes called the diversification multiplier, or in the world of ETFs, the rebalancing premium.
Of course, real markets are a bit messier than Shannon’s simple example, but the basic idea still holds. The different sectors in something like the S&P 500 don’t just bounce around aimlessly—they tend to grow over time—but they also take turns having good and bad years. Sometimes tech stocks are flying while energy is struggling, and then the roles reverse. Materials might take off when there’s a lot of building going on, while healthcare just sits there.
If you just buy everything and let it ride, your portfolio will go up and down with the market, but you’ll end up taking the full hit when a sector crashes, and you might miss out on the chance to lock in gains when another sector is peaking. You’re basically just along for the ride.
But if you set up a rule to rebalance your portfolio every quarter so that each sector gets the same weight, you can actually turn all that bouncing around to your advantage. You end up selling a little bit of the sectors that have just had a great run and using that money to buy more of the ones that have been beaten down. Then, when the cycle turns and those lagging sectors come roaring back, you find yourself holding a bigger chunk of them, bought at bargain prices.
In other words, this approach takes all the chaos of the market and turns it into steady, long-term gains.
Isolating the premium in the real world
If we want to see just how much extra money Shannon’s Demon can actually create over a few decades, the best way is to build a simple Python model that lets us watch two different portfolios grow next to each other.
Trying to pull together data for every single company in the S&P 500 over twenty years gets messy fast, since companies come and go, merge, or change their names. So, to keep things simple and focus just on the math behind equal-weighting, we can use the nine main Sector SPDR ETFs instead. These cover the whole market and have clean, matching price data going all the way back to 2000.
In our simulation, we start with $10,000 on January 1, 2000. The first portfolio, which I’ll call ‘Baseline Drift,’ simply splits the money evenly across all nine sectors at the start and then just sits there—no more trades, no tinkering. This is as close as you can get to a classic buy-and-hold approach.
Portfolio Two is the “Strict Equal-Weight.” It initiates the exact same allocation on day one, but ruthlessly executes the quarterly rebalancing algorithm. At the exact end of March, June, SeptembeThe second portfolio, which I’ll call ‘Strict Equal-Weight,’ starts out exactly the same way, but this time, every three months—at the end of March, June, September, and December—it checks to see how far each sector has drifted from its starting share, and then it moves things around to get everything back to an even split.rsion.
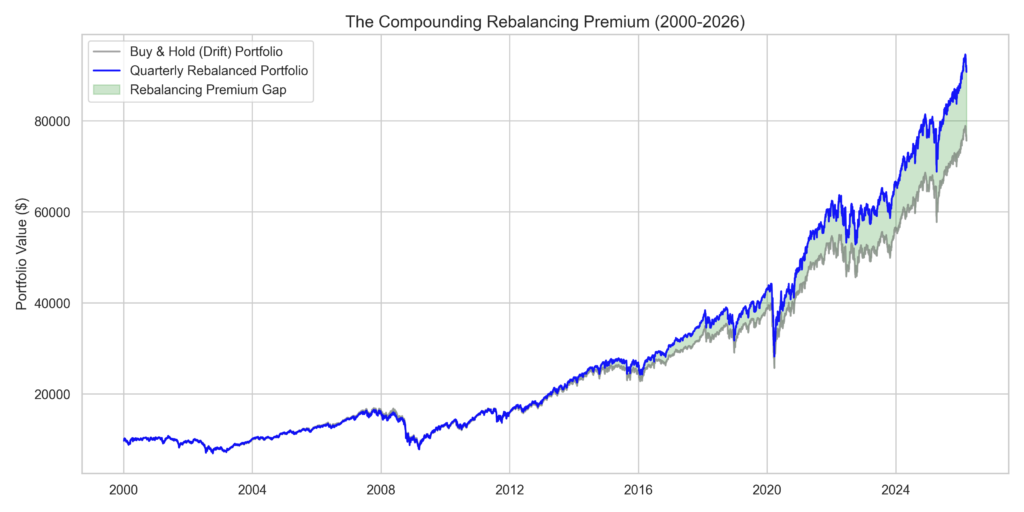
The Python script does all the heavy lifting, tracking every trading day and calculating the yearly growth rate for each approach. The untouched ‘Baseline Drift’ portfolio ended up with an annual return of 8.03%.
The equal-weight portfolio that got rebalanced every quarter did a bit better, with an annual return of 8.79%. Over the whole period, that means the buy-and-hold approach grew by 656%, while the rebalanced one grew by 807%.
So, just by following the simple rule of selling a little from the sectors that have gone up and buying a little more of the ones that have lagged, you end up with a 151% bigger total return—without needing to pick stocks, guess the economy, or try to outsmart the market. That extra 151% is what people call the Rebalancing Premium, and it comes straight from sticking to the math behind Shannon’s Demon and letting the market’s natural swings work in your favor.
If you look at the chart below, you can really see how big this difference gets over time. The grey line is the buy-and-hold portfolio, and the blue line is the one that gets rebalanced every quarter. The growing green gap between them is the extra money you get from rebalancing. It shows, in a pretty clear way, how regularly selling a bit at the highs and buying at the lows can speed up your portfolio’s growth.
The waterfall of terminal value
If we really want to see how building a portfolio with algorithms changes the returns we get over a lifetime, we need to break down where the final dollar amount in our simulation actually comes from, which means looking at how much of it grew naturally just by holding the assets and how much was added by taking advantage of the way their prices move differently from each other when we trade between them.
So, if you look at the chart below, you can see how the returns from our equal-weight sector simulation break down from the very beginning all the way to today, starting with a simple $10,000 as our baseline.
The second column, which we call ‘Baseline Drift Return,’ shows what would have happened if you just bought the nine main market sectors and left them alone for twenty-six years, without touching a thing. That approach would have turned into $65,669 in profit, which is really just the basic growth you get from the market itself, with no trading, no fancy algorithms, and no management fees getting in the way.
But the third column is where things get interesting, because the ‘Rebalancing Premium’ added an extra $15,123 on top of that, just by shifting money between the sectors when their prices moved out of sync.
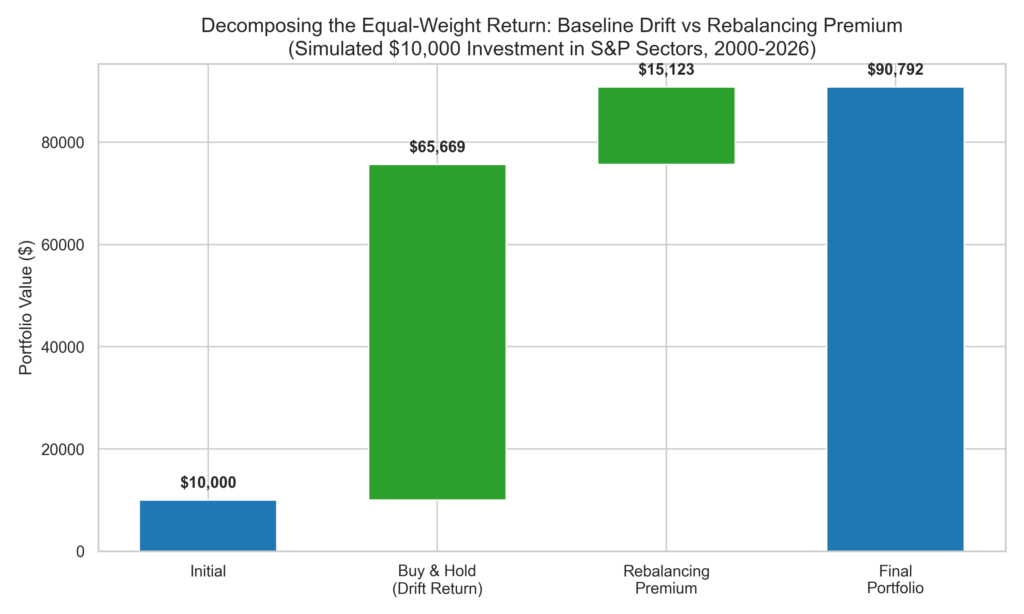
If you ever find yourself in a heated debate about whether equal-weight index investing is worth it, this chart is probably the one you want to look at, because it really shows what the rebalancing process brings to the table. By regularly selling a bit of whatever is getting all the attention and buying more of what everyone else is ignoring, the strategy ends up creating almost 20% of the total gains in the final portfolio, just from this simple act of rebalancing.
Back in 2008, when banks were in real trouble and the whole financial system felt like it might fall apart, the algorithm actually sold some of the safer stocks, like utilities and healthcare, and used that money to buy bank stocks at prices that seemed scary at the time. Then, in late 2021, when tech stocks were all anyone could talk about and their prices were sky-high, the algorithm quietly sold some of those tech shares right at the top and put that money into old-school industries and energy companies that nobody seemed to want.
Every time people have felt the urge to chase whatever is going up the fastest, the algorithm has done the opposite, calmly buying what’s out of favor and selling what’s hot. In a way, it takes all the ups and downs caused by our emotions and turns them into steady, long-term growth inside a tax-friendly account.
The contrarian friction cost
Whenever we talk about structured quantitative finance, there is always some kind of trade-off lurking in the background, and the Rebalancing Premium is no exception, since it still has to play by the basic rules of how markets work; you just can’t expect to see a huge swing in your total return—like a 151% variance—without running into some real-world frictions along the way.
The first and probably most obvious source of friction is what you might call transactional drag, which just means that if you want to harvest volatility, you have to trade a lot, and you have to do it without second-guessing yourself. To keep everything balanced, an equal-weight fund ends up making huge trades every quarter, buying and selling hundreds of millions of dollars’ worth of stocks, often across pretty wide price gaps. These trading costs are something that a regular cap-weighted SPY investor just doesn’t have to worry about, and that’s actually why the expense ratio for an equal-weight ETF like RSP is noticeably higher than what you’d pay for a plain-vanilla passive fund. In a way, you’re paying the pros to run this rebalancing strategy for you, which is a big part of the deal.
The next big hurdle is taxes, which can really take a bite out of your returns if you try to run a heavily rebalanced, equal-weight strategy in a regular taxable account instead of something like an IRA. Every time you sell off your winners to keep things balanced—which happens four times a year—you end up triggering capital gains taxes, both short-term and long-term, and those taxes can easily wipe out the small annual edge we saw in the simulation. So while the Rebalancing Premium looks great on paper, it can quickly turn into a headache once the IRS gets involved.
The last, and maybe the sneakiest, cost of using an equal-weight approach is that it actually puts a lid on your biggest winners. In order to capture the Rebalancing Premium, you end up constantly selling off the stocks that are really taking off, which means you miss out on the full ride when something extraordinary happens.
Think about what happens when a company really changes the game—like when Amazon took over online shopping or Apple became the go-to for mobile devices. Their stock prices can grow at an incredible pace for years, and if you’re in a cap-weighted index, you get to ride that wave all the way up because the portfolio just naturally shifts more weight toward the winners.
But if you’re following an equal-weight strategy, you end up selling a bit of Amazon and Apple every three months, right when they’re on a roll, and then you use that money to buy more of the laggards—maybe regional banks or old-school phone companies—just to keep everything balanced.
The whole idea behind mean reversion is that big price jumps are just temporary blips caused by people overreacting, but that’s not always the case. Sometimes, a huge price move happens because something real has changed in the world, like a company inventing a new technology that actually sticks. The equal-weight approach can’t tell the difference between a short-lived craze and a true breakthrough, so it treats every big move as something to be tamped down right away.
Equal weighting is probably the best hands-off way for regular investors to take a contrarian approach, since it lets you scoop up bargains whenever the market gets jittery, and you don’t need to have a big-picture theory or pay a manager a hefty fee to do it. The math behind the premium is solid, but at the end of the day, you have to ask yourself if it’s worth giving up the chance to fully ride along with the rare companies that end up changing the whole game for everyone else.
References
[1] Booth, D. G., & Fama, E. F. (1992). Diversification Returns and Asset Contributions. Financial Analysts Journal.
[2] Shannon, C. E. (1956). Mathematics of investment. Bell System Technical Journal.
[3] S&P Dow Jones Indices. (2025). S&P 500 Equal Weight Index Methodology.
[4] yfinance Documentation and API data. (2026). Historical closing data mapped against sector SPDR ETFs (2000-2026).

Leave a Reply