Disclaimer: The opinions expressed in this article are my own and do not represent the views of Google. This content is based solely on publicly available information.This content is for educational and entertainment purposes only. The author is not a financial advisor, and the content within does not constitute financial advice. All investment strategies and financial decisions involve risk. Readers should conduct their own research or consult a certified financial professional before making any financial decisions.
Smart beta is one of those ideas that shows just how powerful a good marketing story can be in the world of investing, because by simply adding the word ‘smart’ to an index fund, Wall Street managed to get a lot of people to pay two, three, or even four times as much in fees as they would for a plain old S&P 500 ETF.
The sales pitch for smart beta is pretty tempting, since it promises that, rather than just following the crowd and buying more of a stock as it gets more expensive, a special algorithm will pick and choose stocks for you in a way that aims to smooth out the bumps, boost your dividends, or catch the next big winner. On the surface, it feels like you are getting access to the kind of fancy tools that big hedge funds use, only now they are available to regular folks. But when you look a little closer, the story starts to fall apart.
If you dig past the glossy brochures and all the complicated explanations, you will find that most smart beta funds are not doing anything especially clever. What they are really doing is taking ideas that academics figured out a long time ago and wrapping them up in a new package, then charging you extra for something you could get much cheaper elsewhere.
You do not have to take their word for it, and you do not need to know the secret recipe behind their strategies, because you can actually look at how these funds have performed in the past and compare them to some well-known building blocks that researchers have used for years. If you run a simple regression analysis—basically, a way to see how much of the fund’s returns can be explained by these classic factors—you will find that the numbers tell a much simpler story than the marketing does, and you can see what you are really getting for your money.
The death of expensive beta
If we want to figure out why smart beta became a thing, it helps to start by looking at how the asset management business works. For a long time, mutual fund managers would charge you one or two percent every year, all with the promise that they could do better than the market.
But then John Bogle came along with the first index fund that just tracked the market, and over time, the data made it pretty clear that most active managers just couldn’t keep up with a basic market-cap weighted index if you gave it enough years. People started to notice that they were shelling out a lot of money for something that, in the end, didn’t really do any better than just owning the whole market. So, money started moving out of those expensive mutual funds and into low-cost, passive ETFs instead.
Once getting the market return became something anyone could do for almost nothing, the whole industry had to rethink what it was offering. After all, if you can get the same results from Vanguard for just a tiny fee, it’s pretty hard to explain why someone should pay a lot more for the same thing. So, the industry started looking for a new kind of product—something that sounded a bit more sophisticated, so they could still charge higher fees, but that also followed clear rules to avoid the pitfalls that came with relying on human stock pickers.
That’s where smart beta came in. It was meant to fill the space between pricey active management and the super-cheap index funds. Fund companies started rolling out products that tracked their own custom indexes, building them around ideas like volatility, quality, value, or momentum.
A lot of everyday investors jumped into these new funds, but when you look under the hood, it’s hard to see how the way these funds actually work really makes up for the extra fees they charge.
The primitive building blocks of equity returns
Back in 1992, Eugene Fama and Kenneth French came along and showed us that the market isn’t just one big, mysterious number moving up and down, but actually a mix of different ingredients, each with its own flavor, and they did this by breaking down stock returns into a few key risk factors that we can actually see and measure.
What they came up with is called the three-factor model, which basically says that stock returns are shaped by three things: the overall market’s ups and downs (which is what people usually call ‘beta’), the fact that smaller companies have tended to do better than bigger ones over time, and the idea that companies that look cheap on paper (meaning their book value is high compared to their market price) have often outperformed the pricier, fast-growing ones; then, a bit later, researchers like Mark Carhart added another piece to the puzzle by noticing that stocks that have been rising lately often keep rising for a while, which is what people call momentum.
You can think of these factors as the basic colors you start with when you’re painting; you can’t really make a brand new color out of thin air, but you can mix the ones you have in all sorts of ways to get different shades, and that’s pretty much how these risk factors work in the stock market.
When you buy a regular index fund, you’re basically getting the plain market flavor for almost no fee, but smart beta funds say they’re doing something a bit fancier by trying to scoop up these little quirks and patterns in the market, hoping to squeeze out a better return for the amount of risk you take.
So let’s see if that idea actually holds up when we look at the numbers.
Setting up the factor regression test
If a smart beta fund really does have its own special way of picking up returns that nobody else has found, then you would expect its performance to be a little mysterious, in the sense that the usual Fama-French factors shouldn’t be able to explain everything that’s going on—there should be some leftover returns that don’t fit neatly into the standard boxes.
To see if this idea holds up, I put together a quick Python script and decided to focus on the iShares MSCI USA Min Vol Factor ETF, or USMV for short, since it’s one of the biggest and most well-known smart beta funds out there, with billions invested in it. The pitch for USMV is that it should help cushion you when the market gets rough, giving you a steadier experience than just owning the whole market. The way it tries to do this is by using its own method—something about crunching a lot of numbers to find a mix of stocks that, at least in theory, should bounce around less than the rest.
So, I grabbed daily price data for USMV going back to 2015 and lined it up with the Fama-French factor data for the same days—these are the usual suspects like market risk, size, value, and momentum. After putting all the numbers together, I worked out how much USMV earned above the risk-free rate each day, and then ran a regression to see how much of those returns could be explained just by these basic building blocks.
What this regression is really doing is trying to see if you can build up USMV’s daily returns just by mixing and matching these well-known factors, without needing any secret sauce. If USMV is actually doing something special, then this simple recipe shouldn’t be able to explain everything you see in its returns.
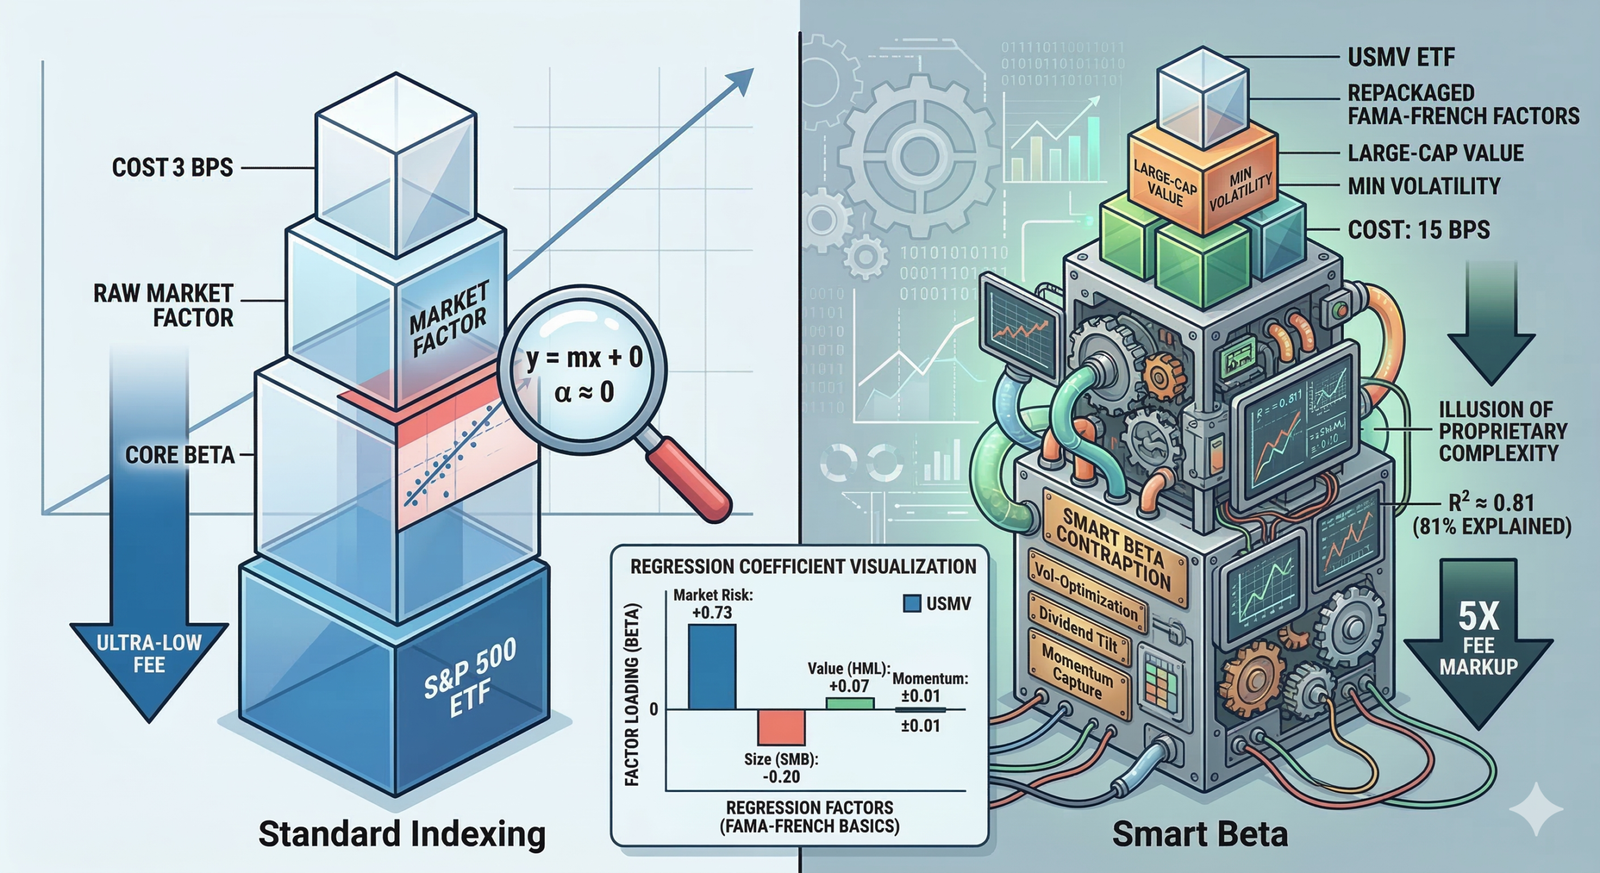
Once you run the regression, the numbers quickly cut through any sense that there is some secret sauce at work here, because the R-squared comes out to 0.81, which is pretty remarkable when you think about it. What this really means is that about 81% of all those tiny, day-to-day price changes in this supposedly advanced smart beta ETF can be chalked up to the same old academic factors that everyone knows about. So, there is not much mystery left under the surface, and the last 19% is probably just random noise or small tracking errors, rather than some hidden way to beat the market.
If we take a closer look at the regression coefficients, we can actually see the exact blend of standard factors that the ETF manager is putting together and offering to investors. For example, the market beta comes in at 0.73, which lines up with what you would expect, since the whole idea behind a ‘minimum volatility’ strategy is just to take on less market risk. So, if the S&P 500 falls by 1%, you would expect USMV to drop by about 0.73%, just following the math.
The size factor, known as SMB, shows up as -0.20, and if you are familiar with the Fama-French model, you know that this factor is all about how small companies tend to do compared to big ones. A negative number here just tells us that the fund is leaning heavily toward the big, well-known companies and is basically betting against the smaller ones. That makes sense, since large-cap stocks usually bounce around less than small-caps, but it also means the fund is giving up the extra returns that sometimes come from owning those smaller, less liquid companies.
The value factor, called HML, comes in at 0.07, which shows the fund has a real, measurable tilt toward value companies instead of chasing after the fast-growing, headline-grabbing stocks. Value companies are usually the ones with steady cash flows and regular dividends, so their prices do not swing around as much day to day. In a way, this keeps the stock price grounded in something real, instead of being tied to hopes about future profits from the next big tech company.
When it comes to momentum, the factor is basically a non-factor here, since it is right around zero and not statistically meaningful. The algorithm is not interested in whether a stock is on a hot streak or falling out of favor; it is just focused on how much the price bounces around and how the stocks move together. You can see exactly how these factors stack up in the chart below.
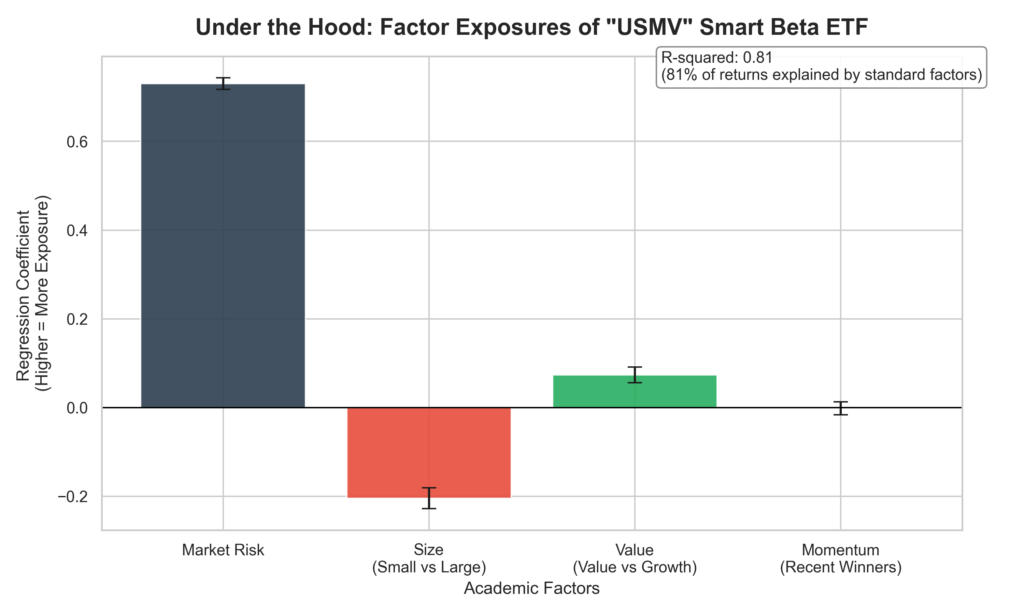
If you look past all the thick methodology documents and the glossy marketing language, what you really see in this chart is just the math underneath, which shows that the so-called proprietary algorithm is basically the same as buying a large-cap value portfolio and always keeping a bit of cash on the side to keep the portfolio’s risk level lower.
You could actually put together the same mix of risks and returns yourself, just by combining a low-cost S&P 500 index fund with a cheap large-cap value ETF and a bit of short-term Treasury bills, and you’d end up with the same ups and downs, the same long-term results, and none of the extra cost that comes from fancy marketing.
The structural cost of complexity
Smart beta wasn’t really invented as a gift to investors like us; instead, it came about because asset managers needed a way to keep their businesses healthy while fees on traditional funds kept dropping.
Take the USMV ETF as an example: its expense ratio is 0.15%, which might seem like a bargain, especially if you remember the days when mutual funds regularly charged over 1%. But if you look at what you could pay for a similar level of market exposure, you’ll find that something like the Vanguard S&P 500 ETF (VOO) only charges 0.03%.
So, in practice, you’re paying about five times as much in fees for a fund that mostly just shifts your money a bit more toward big, stable companies and tries to keep the ups and downs a little smoother.
Now, it’s true that if you focus your investments on certain factors, like value or momentum, you can change how your returns look over the long run, and lowering your exposure to big market swings can help cushion the blow during tough times. These are real effects that show up in the math.
But the important question is whether you’re actually getting something special for that extra fee, or if you’re just paying more for a fund that mostly follows a well-known recipe that anyone could copy. When you break down the numbers, most smart beta funds seem to fall into that second group.
The hidden risk of naive optimization
If you look a little closer at smart beta funds, you’ll notice there’s a bigger issue hiding under the surface, because when algorithms are set up just to chase the lowest historical volatility, they can end up piling into just a few sectors without really meaning to.
Let’s say something like utilities or consumer staples has had a long stretch—maybe thirty years—of calm, mostly because interest rates kept dropping. If you feed that history into a basic optimization algorithm, it will end up putting a lot of weight on those sectors. So, while you might think you’re buying an ETF that spreads your risk across the whole economy, what you’re really getting is a portfolio that’s heavily tied to just one thing: interest rates. In a way, it’s almost like buying a bond in disguise, even though it looks like a mix of stocks.
But when the big picture changes—like if interest rates suddenly jump or inflation takes off—those old patterns just fall apart. The sectors that seemed so steady can suddenly drop hard, and the algorithm that looked so smart before just doesn’t know what to do. If you’re holding one of these smart beta ETFs, you might be left wondering why your supposedly safe fund is falling just as much as everything else. It’s easy to forget that a model built on yesterday’s data can’t always see what’s coming next, especially when the world gets unpredictable.
We actually saw this play out during the COVID crash in early 2020. A lot of people held onto low-volatility funds, hoping they’d be a safe haven, but when panic hit, everything started moving together. Those funds dropped right alongside the rest of the market, showing just how risky it can be to trust only in what the numbers from the past are telling us about the future.
Traditional index funds that just follow the market’s size don’t run into this particular problem, because they spread your money across the whole economy, letting the collective choices of everyone in the market decide the weights. They don’t try to guess that the future will look exactly like the past—they just take the market as it is today.
The illusion of downside protection
It’s easy to see why smart beta strategies are so tempting, especially when you think about how tough it is to stay calm while the market bounces around every day. When you watch a big chunk of your savings disappear during a rough market downturn, it’s only natural to feel the urge to sell at exactly the wrong moment, right when things are at their worst. This kind of reaction is just part of how we’re wired.
A lot of funds that advertise things like ‘minimum volatility’ or downside protection are really tapping into that very human fear of losing money, and they often make it sound like you can have all the growth of stocks with none of the risk you get from bonds. The thing is, the math just doesn’t work that way, because in the world of investing, risk and reward are always linked together. If you want the chance for big gains, you have to accept that your investment will bounce around a bit along the way.
If you set up a portfolio that is designed to be less risky, say with a beta of 0.73, you’ll probably feel a little less pain when the market takes a big hit—so if the market falls by half, your portfolio might only fall by about a third. But it’s important to remember that this works both ways: when the market is booming, especially during those big years when technology stocks or easy money policies push everything higher, your lower-risk portfolio is going to miss out on a lot of those gains. So, while you’re protecting yourself on the downside, you’re also giving up some of the upside.
On top of that, the higher fees that come with these kinds of funds can quietly eat away at your returns, even if it doesn’t seem like much at first glance. While the difference between a 0.15% fee and a 0.03% fee might look tiny over ten years, if you stretch that out over forty years, those small numbers can add up to tens of thousands of dollars that never make it into your pocket. So, in the end, you could be paying a lot more just to get less, especially during the best years for the market.
The good news is, you don’t need anything fancy or complicated to make your portfolio less jumpy. Just by mixing in some regular old bonds with your stock index funds, you can get almost the same level of stability as those expensive smart beta funds, but at a much lower cost and with the added bonus of always knowing exactly what you own.
Stop paying for the packaging
Sometimes, financial engineering can make things look much more complicated than they really are, mostly because the math and the jargon can be intimidating, and most of us are not going to spend our evenings downloading return data and running fancy regressions just to figure out what is actually going on inside these products.
But if you start thinking about your own finances the way an engineer might—looking for ways to make the whole system work better for you—you can actually take control and optimize things in a way that makes sense for your life.
So, before you put a big chunk of your savings into a smart beta ETF, it helps to pause and ask what you are really getting—because sometimes, these funds are just packaging up basic things like large-cap value stocks or low-volatility stocks, and you can often build that same mix yourself with simple, low-cost index funds.
In the end, it is usually better to skip the expensive packaging and avoid paying high fees for something you could easily put together on your own, so you can keep more of your money working for you over time.
References
[1] Asness, C. S., Frazzini, A., Israel, R., & Moskowitz, T. J. (2014). Fact, Fiction, and Momentum Investing. The Journal of Portfolio Management, 40(5), 75-92.
[2] Bogle, J. C. (2017). The Little Book of Common Sense Investing: The Only Way to Guarantee Your Fair Share of Stock Market Returns. John Wiley & Sons.
[3] Carhart, M. M. (1997). On Persistence in Mutual Fund Performance. The Journal of Finance, 52(1), 57-82.
[4] Fama, E. F., & French, K. R. (1992). The Cross-Section of Expected Stock Returns. The Journal of Finance, 47(2), 427-465.
[5] Fama, E. F., & French, K. R. (2015). A Five-Factor Asset Pricing Model. Journal of Financial Economics, 116(1), 1-22.
[6] iShares MSCI USA Min Vol Factor ETF (USMV) Historical Data. (2026). Yahoo Finance.
[7] Kenneth R. French Data Library. (2026). Fama/French 3 Research Factors and Momentum Factor.

Leave a Reply