Disclaimer: The opinions expressed in this article are my own and do not represent the views of Google. This content is based solely on publicly available information.This content is for educational and entertainment purposes only. The author is not a financial advisor, and the content within does not constitute financial advice. All investment strategies and financial decisions involve risk. Readers should conduct their own research or consult a certified financial professional before making any financial decisions.
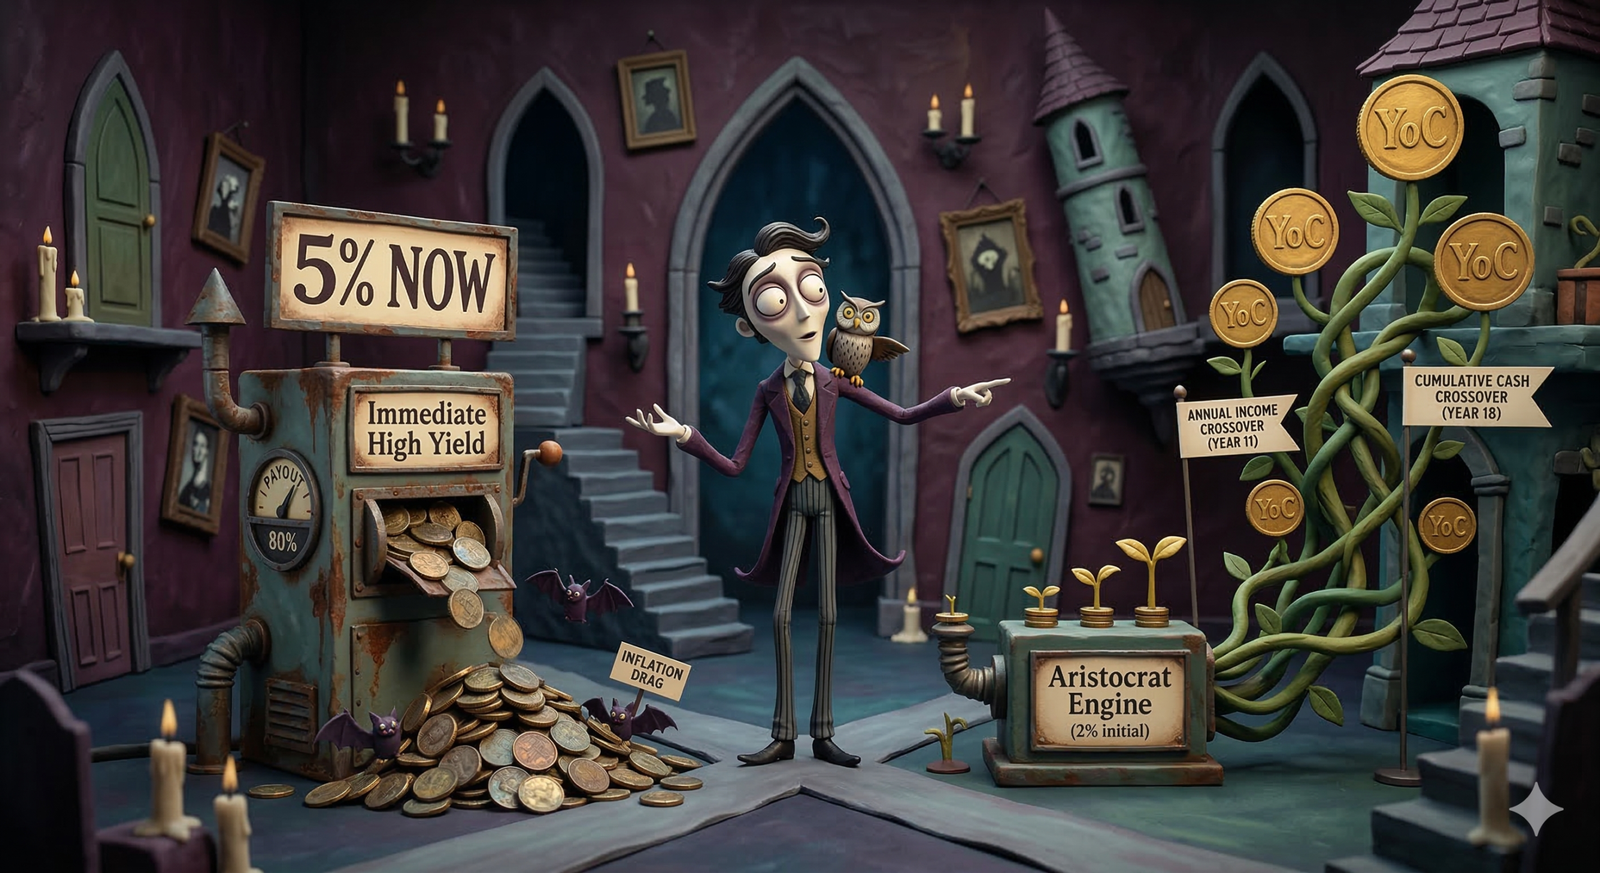
If you’ve ever tried to build an income-focused portfolio, you’ve probably noticed how easy it is to get drawn in by the biggest, shiniest yield you can find, because our brains are wired to want results right away. So when you see a telecom company offering a steady 5% dividend and an industrial company only paying 2%, it’s totally natural to think the telecom is the obvious winner, since that upfront 5% just looks so much better on paper.
But the thing is, chasing that high yield right out of the gate means you’re missing out on how compounding really works over the long haul. Companies that pay out most of their cash right away usually don’t have much left to invest in themselves, so their dividends tend to stay flat year after year, and over time, inflation quietly chips away at what those payouts can actually buy you.
On the other hand, if you put your money into a company that’s known for steadily growing its dividend every year, you might have to settle for a smaller payout at first, which can feel a bit disappointing. Still, if you’re patient and let that lower starting yield grow over time, you’ll often find that the income from these steady growers eventually leaves the high-yield, no-growth options in the dust.
If you want to see how this plays out in real numbers, you can actually map out the cash flow from a fast-growing dividend stock next to a high-yield, no-growth stock, and you’ll notice there’s a point where the steady grower’s income finally catches up and then pulls ahead, all thanks to the magic of compounding over time.
Yield-on-cost metrics
If you want to really understand how well your dividend income stream is working for you, relying on the usual ‘current yield’ metric can actually be pretty misleading, since it only looks at the dividend payout compared to whatever the stock happens to be trading at right now, which means it jumps around all the time. When the stock price falls, the current yield suddenly looks much higher, and when the price goes up, the yield seems to shrink, but neither of those changes actually tells you anything useful if you’ve been holding the stock for a while.
Instead, if you’re trying to figure out how your long-term income portfolio is really doing, it makes a lot more sense to look at something called Yield-on-Cost, or YoC for short.
Yield-on-Cost is just a way of measuring how much dividend money you’re getting today compared to what you originally paid for your shares, so if you bought a share for a hundred dollars ten years ago and now you’re getting ten dollars a year in dividends, your Yield-on-Cost is 10 percent, no matter what the stock is trading for now. Even if the price has shot up to five hundred dollars and the current yield looks tiny, you’re still earning 10 percent on what you actually put in.
What this really means is that Yield-on-Cost shows you how quickly you’re getting your money back through dividends. If you buy a stock that pays a high dividend but never increases it, like a utility company that’s already paying out most of its profits, your Yield-on-Cost just stays flat at whatever it was when you bought in, so you keep getting the same five dollars for every hundred you invested, year after year.
But if you look at companies that have a habit of raising their dividends every year, even if you start out with a pretty low Yield-on-Cost, like 2 percent, things can change a lot over time. If the company keeps growing its dividend by 10 percent each year, the amount of cash you get from your original investment starts to climb much faster, and that happens whether or not the stock price moves at all.
To see how this plays out over the long run, we built a simple Python simulation that tracks how Yield-on-Cost changes over twenty years, and it really shows how a steadily growing dividend can eventually catch up to, and even beat, a stock that started out with a higher yield but never increased its payout.
The dividend growth engine
If you look at the graph below, you’ll see how Yield-on-Cost plays out over twenty years for two made-up investments. The red dashed line shows what happens if you start with a high yield—say, 5%—but that number never grows, so it just sits there, flat as a pancake. The thick blue line, on the other hand, starts off much lower at 2%, but it keeps climbing because the dividend goes up by 10% every year, which really adds up over time.
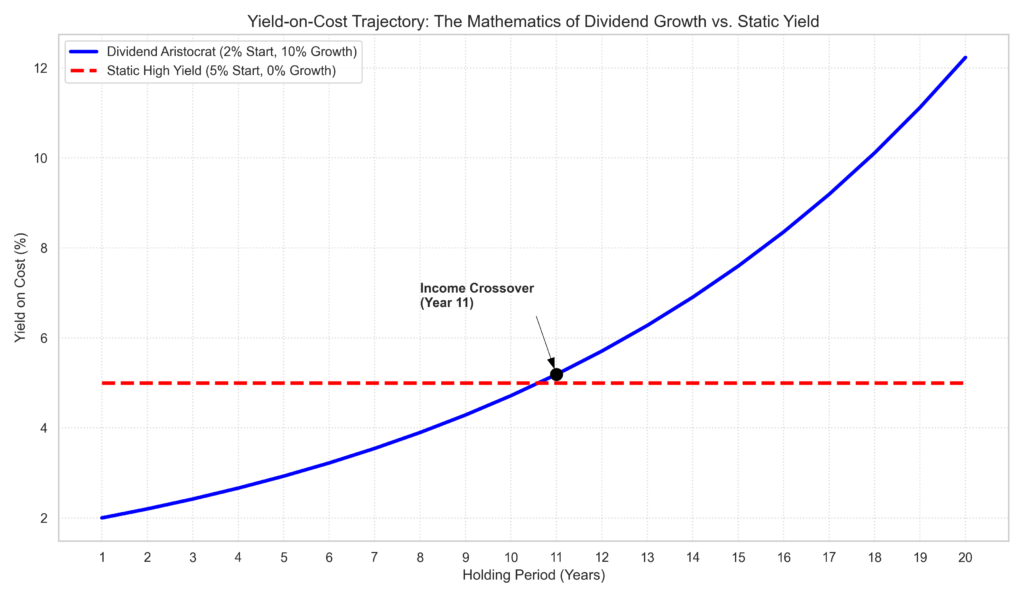
If we look at the chart, it’s pretty clear that for the first ten years, the high-yield option comes out ahead when it comes to income. The red dashed line just sits above everything else during this stretch, so if someone really needs the most cash right now—like a retiree who depends on that money to pay the bills—the 5% yield makes sense for them. You can actually see the blue line working hard to catch up, but at first, the gap between the two is pretty big.
But the real magic happens because of compounding. Since the 10% growth builds on top of last year’s bigger number, the amount of extra cash you get each year starts out small—at first, boosting a 2% yield by ten percent barely moves the needle. But as the years go by and that base gets bigger, those yearly increases start to add up in a big way, and by the time you hit the second decade, the growth really starts to show up on the chart.
By the time you reach year twenty, the dividend growth approach leaves the high-yield option far behind. The simulation shows that at this point, the Dividend Aristocrat is paying out a yield-on-cost of 12.2%, which is a huge jump from where it started.
So after twenty years, if you went with the Aristocrat, you’d be getting over twelve dollars in cash each year for every hundred dollars you originally put in. Meanwhile, the person who chose the high-yield option is still getting the same five dollars a year they started with, which doesn’t go nearly as far after two decades of inflation.
That’s really the heart of how dividend growth works. You start with an investment that might not look exciting at first, but because it keeps growing, your income from it can end up much higher than you might expect. Over time, those steady increases can turn a slow start into something that really takes off.
Identifying crossover thresholds
If you take a look at the chart, you’ll notice that during the first ten years, the high-yield option tends to lead the pack in terms of income, since the red dashed line stays above the others for quite a while. This means that if someone needs the most cash right away, maybe because they’re retired and relying on that money for everyday expenses, the 5% yield can seem like the obvious choice. Meanwhile, you can watch the blue line steadily trying to close the gap, although in those early years, it’s still trailing by a fair amount.
What really changes the picture, though, is compounding, because when you have 10% growth building on top of last year’s larger number, the extra cash you get each year might not seem like much at first—especially since increasing a 2% yield by ten percent doesn’t make a huge difference right away. But as the years roll on and your starting point keeps getting bigger, those yearly bumps begin to stack up, and by the time you’re looking at the second decade, you can really see that growth making a difference on the chart.
Once you get to year twenty, you can see that the dividend growth approach has pulled far ahead of the high-yield option, since the simulation shows the Dividend Aristocrat paying out a yield-on-cost of 12.2 percent, which is quite a leap from where things began.
So after two decades, if you had chosen the Aristocrat, you’d be receiving more than twelve dollars in cash each year for every hundred dollars you originally invested, while someone who picked the high-yield option would still be getting the same five dollars a year they started with, which probably doesn’t stretch as far after twenty years of rising prices.
That’s the core idea behind dividend growth: you might begin with an investment that doesn’t seem all that exciting, but because it keeps growing, the income you get from it can eventually end up much higher than you might have guessed. Over time, those steady increases can turn what felt like a slow beginning into something that really gains momentum.
The mathematics of the payout ratio
The main problem with a static high-yield investment really comes down to where that yield is actually coming from. If you want to build a steady stream of income, it’s important to look closely at how a company is able to pay out something like a 5% starting dividend, and that means digging into the payout ratio to see if it’s sustainable.
The payout ratio is just a way to see what percentage of a company’s free cash flow is being sent out to shareholders as dividends. For example, if a big telecom company earns a billion dollars and pays out eight hundred million of that as dividends, its payout ratio is a pretty aggressive 80%.
When a company pays out that much of its cash, it leaves very little behind to invest in its own growth. With 80% of the money going straight to dividends, there just isn’t much left over for things like research, buying up new tech companies, or paying down debt. At that point, the business stops being a source of new ideas and starts acting more like a bond that just sits there.
Once the company’s growth slows down, it just can’t keep increasing the dividend. If they tried to boost an already high 80% payout by 10% each year, they’d run out of cash in just a few years. At that point, the only way to keep paying the dividend would be to borrow money, which usually ends badly and often leads to the dividend getting cut altogether.
A high starting yield is often a sign that the company is already paying out as much as it can. Usually, the reason the yield is so high is because the business can’t find good ways to grow with the money it makes, so it just gives most of it back to shareholders.
On the other hand, companies known as Dividend Aristocrats do the opposite. They usually keep their payout ratios low, often paying out just 25% to 30% of their cash as dividends and using the rest to grow the business from within. Because their core business keeps growing at a healthy pace, they can afford to raise their dividends by 10% a year without ever putting too much strain on their finances. That steady growth is what makes their dividends sustainable.
The silent drag of inflation
If we look at the yield of an investment without thinking about things like inflation, we’re missing a huge part of the picture. When you put your money into something that pays a fixed high yield but doesn’t have any way to grow on its own, you’re basically agreeing to take on all the risk that comes from changes in the value of money over time.
You can see this problem clearly if you look at the flat red dashed line in the simulation. Let’s say you invest a thousand dollars and get a steady 5% yield, so you earn fifty dollars every year. That sounds great at first, but if inflation runs at just 3% a year, then by the time you reach year twenty, that same fifty dollars will only buy what twenty-seven dollars could buy at the start. In other words, the real value of your returns gets cut in half simply because your payout doesn’t keep up with rising prices.
If you look at the steadily rising blue line of the Aristocrat, what you see is a kind of built-in shield against the sneaky way inflation eats away at your money. Since it grows at about 10% a year, which is much faster than the usual 3% rate at which money tends to lose value, it means that even as your grocery bills and utility costs climb over the next twenty years, the dividends you get from this investment should more than keep up. In fact, these growing payouts can help you not just keep your standard of living steady, but actually improve it, even when prices are jumping all around you. So, what you really have here is a financial tool that is designed to help you stay ahead of inflation, no matter what happens to the share price itself.
The behavioral cost of the crossover
If you look at the numbers, it’s clear that over time, a strategy focused on growing dividends will eventually leave a high-yield, no-growth approach in the dust. The real challenge, though, is all about timing. It’s tough to ask a regular investor to pick a low 2% starting yield and then patiently accept smaller payouts for a whole decade, since most of us just aren’t wired to wait that long for results.
When the economy takes a nosedive and markets drop, holding onto something that only pays you 2% can feel pretty painful. Even if you know those dividends are supposed to grow, that promise doesn’t really help when you’re watching your account balance shrink. On the other hand, getting a big 5% payout right in the middle of a rough patch feels comforting, even if it means you’re stuck with an investment that might not actually go anywhere in the long run.
To really make a dividend growth strategy work, you need to know exactly when those growing payouts will actually catch up to and pass the higher-yield option. If you go in expecting big results by year five, you might end up disappointed, and there’s a good chance you’ll give up on the whole plan just before things really start to take off.
It’s important to think about where you are in your investing journey. If you have decades ahead of you, you can afford to ignore that low starting yield and let the power of compounding do the hard work over time.
But if you’re already retired and need your investments to pay the bills right now, you can’t really wait around for years hoping for those dividends to catch up. In that case, the long-term potential doesn’t matter much if you need cash in the short term.
At its core, the dividend growth approach is all about trading patience now for much bigger rewards later. It asks you to look past the small payouts at the start and trust that, over time, those growing dividends will really add up.
References
[1] Miller, M. H., & Modigliani, F. (1961). Dividend Policy, Growth, and the Valuation of Shares. The Journal of Business.
[2] Fama, E. F., & French, K. R. (2001). Disappearing Dividends: Changing Firm Characteristics or Lower Propensity to Pay? Journal of Financial Economics.
[3] Arnott, R. D., & Asness, C. S. (2003). Surprise! Higher Dividends = Higher Earnings Growth. Financial Analysts Journal.
[4] Standard & Poor’s. (2025). S&P 500 Dividend Aristocrats Index Methodology and Historical Performance Metrics.

Leave a Reply