Disclaimer: The opinions expressed in this article are my own and do not represent the views of Google. This content is based solely on publicly available information.This content is for educational and entertainment purposes only. The author is not a financial advisor, and the content within does not constitute financial advice. All investment strategies and financial decisions involve risk. Readers should conduct their own research or consult a certified financial professional before making any financial decisions.
A lot of people think that when they buy an index fund, they’re getting a nice, even slice of the whole American economy, but that’s not really how it works. If you pick up a typical S&P 500 index fund today, what you’re actually getting is a big helping of the largest tech companies, with just a tiny sprinkle of the other 490 companies tagging along in much smaller amounts.
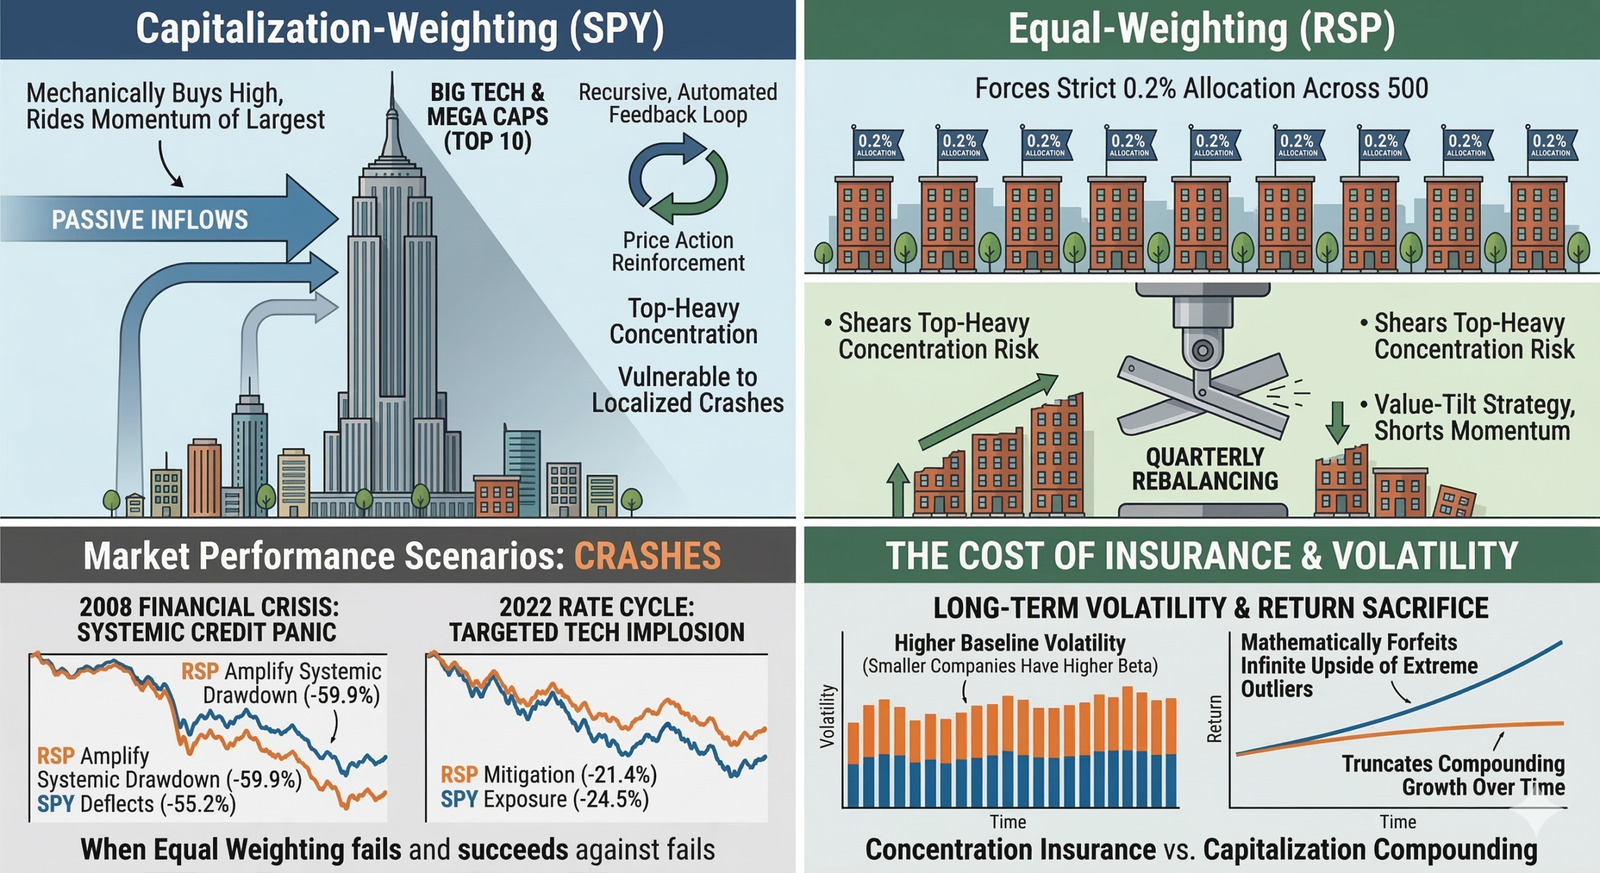
Because the S&P 500 is built around company size, most of the money that flows in ends up going straight to the biggest, priciest companies. So, every time someone invests in the index, they’re mostly buying more of those giants, which pushes their prices up even further and keeps the cycle going. This setup can really boost returns when the market is rising, but it also means that if those big companies stumble, the whole index can take a hit all at once.
That’s where the idea of an equal-weight index comes in. With something like the Invesco S&P 500 Equal Weight ETF, every company gets the same small share, so no single giant can dominate the whole fund. Advisors often pitch these funds as a safer bet because they spread your money out more evenly, which sounds good in theory, but when you look at the numbers, the story turns out to be a bit more complicated than that.
If you look at the math, putting more money into the biggest companies can actually boost your long-term returns, but the flipside is that when those big names hit a rough patch, the swings can be tough to stomach and can shake investors’ confidence. So, equal-weight funds aren’t really about getting better returns; they’re more like a kind of insurance against having too much riding on just a few companies. The trade-off is that you give up some of the big gains when the giants are doing well, in exchange for a smoother ride. It’s worth digging into how much that safety net actually costs, when it really helps, and when it might actually work against you.
The mechanical reality of capitalization weighting
When we talk about capitalization weighting, what we’re really saying is that the index doesn’t care about whether a company is cheap or expensive based on any fundamental measure; it just looks at how big each company is in total market value and allocates accordingly. So, if a handful of companies catch fire—maybe because investors get excited, or their profits shoot up, or central banks flood the market with cash—their share of the index grows right along with them. This means a cap-weighted index ends up buying more of what’s already gone up and less of what’s lagging behind, which is a bit like always chasing the biggest winners and letting them keep driving your results. In practice, you’re putting your money behind the idea that the biggest, most dominant companies will keep pulling ahead.
If you look at how a cap-weighted index works in a market where just a few companies are doing most of the heavy lifting, you’ll notice that maybe ten out of five hundred names are responsible for almost all the gains. By owning the market in proportion to each company’s size, you end up riding along with those rare, runaway winners, and you get the full benefit of their compounding growth. That’s a big reason why it’s so tough for most active managers to beat a plain old cap-weighted index over the long haul—it automatically follows the classic advice to let your winners run and cut your losers, but it does it in a way that’s built right into the math.
Equal weighting takes a completely different approach. Instead of letting the biggest companies dominate, it gives every company the same slice of the pie—so for something like RSP, that means each stock gets about 0.2% of the total. To keep things balanced, the fund has to rebalance every quarter, which means selling a bit of the stocks that have gone up and buying more of the ones that have dropped. In a way, it’s like always betting that the underdogs will bounce back and the high-flyers will cool off, so you end up with a strategy that leans toward value and pushes back against momentum.
All this rebalancing doesn’t come for free, though. While a cap-weighted index mostly takes care of itself—since the weights adjust automatically as prices move—an equal-weight fund has to keep trading to stay balanced, quarter after quarter. That means more buying and selling, which adds up to higher transaction costs over time and creates a small but steady drag on your returns.
But maybe the biggest drawback is that this constant rebalancing keeps you from fully riding the wave when a handful of giant tech companies go on a tear. On paper, selling some of your winners to buy more of your laggards looks like smart risk management, but in reality, it often means you’re selling pieces of the strongest, most successful businesses just to buy more of the ones that are struggling or falling behind.
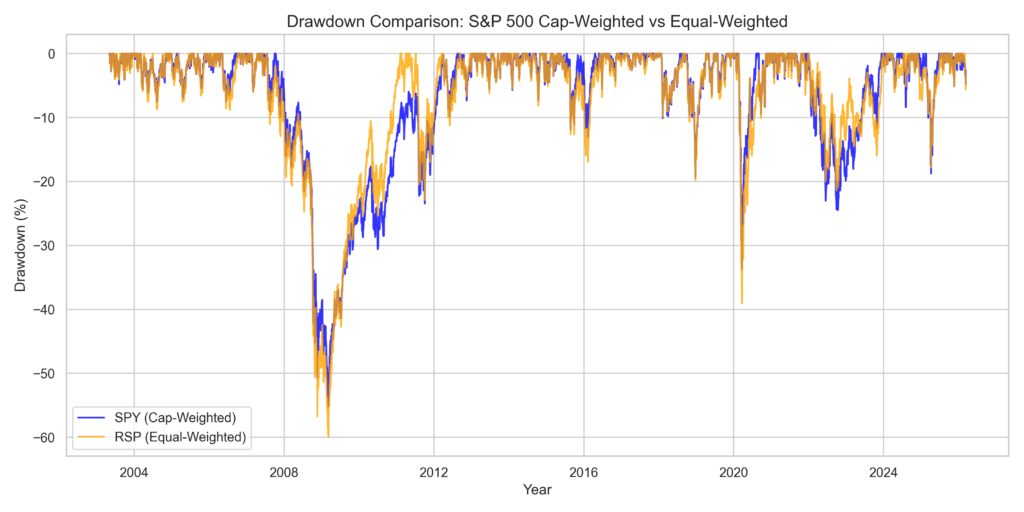
When I ran a Python simulation to see exactly how SPY and RSP performed over time, looking at both returns and how much their prices bounced around over rolling three-year periods, it became clear when equal weighting helps and when it hurts. By pulling in daily price data from when RSP started in 2003 all the way through early 2026, I could zoom in on the two biggest market shocks of our era: the broad panic of the 2008 financial crisis and the more focused tech and interest rate slump in 2022. The numbers paint a pretty clear picture of what kinds of risks equal weighting actually shields you from, and what you end up paying for that protection.
When equal weighting fails to protect
If we look back at 2008, what really happened was that credit just stopped working everywhere, all at once. It did not matter if you were in investment banking, commercial real estate, raw materials, or even building cars—suddenly, there was no money moving, and every part of the market felt it.
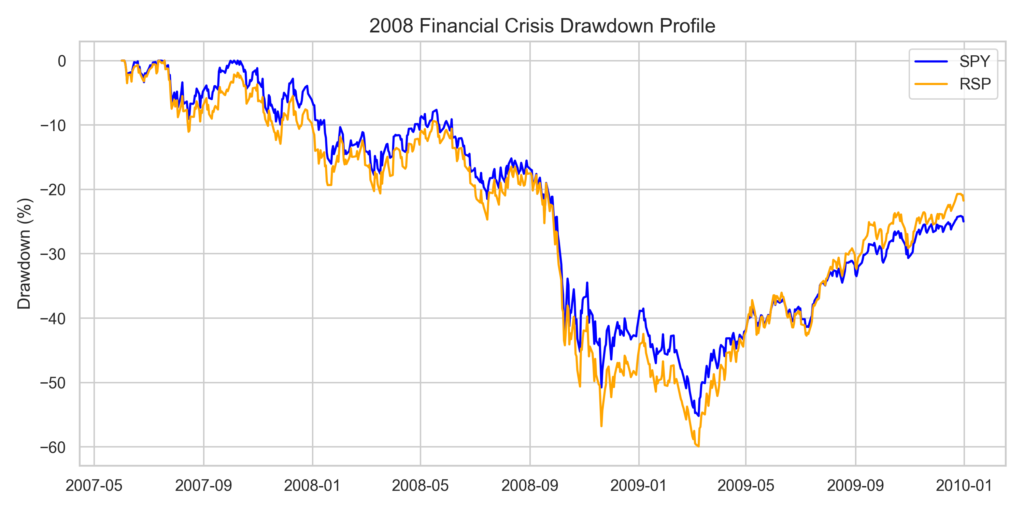
If you actually run the numbers on how much the market dropped between mid-2007 and early 2009, you start to see that the usual story about equal-weighting being safer just does not hold up. In a true crisis, when almost every mid-sized bank, heavily indebted industrial company, and retail stock is staring down bankruptcy, treating them the same as the giant, well-funded companies in the SPY turns out to be a recipe for trouble.
Once you actually run the drawdown calculation for this period, the difference that pops out is pretty striking. RSP experienced a peak-to-trough collapse of 59.9% while SPY experienced a peak-to-trough collapse of 55.2%.
If you look at the chart below, you can see both ETFs side by side from when they started all the way to today. That huge dip on the left is the 2008 crisis, and it really shows just how much further the equal-weight RSP (in orange) fell compared to the cap-weighted SPY (in blue).
What actually happened here goes against the usual advice you hear from financial experts. When you split your money equally across all the companies in the S&P 500, you end up taking a much bigger hit during a crisis, mostly because the smaller companies—especially the ones carrying a lot of debt—get hit the hardest when credit dries up. In 2008, the biggest companies in the index, the ones with strong balance sheets and plenty of cash, were able to weather the storm much better than the smaller, more fragile firms, so the cap-weighted approach ended up being a lot more resilient in that environment.
Trying to spread your bets across every part of a system that’s already falling apart just means you end up sharing in all the trouble. If you put your money into the smallest and weakest companies during a time when cash is hard to come by, you’ll probably do worse than if you stick with the bigger players that have the strength to make it through tough times.
If you look at the close-up chart of what happened in 2008, it’s clear just how rough things got. The line for the equal-weighted index falls much faster and further than the one for the cap-weighted index, showing that splitting things up equally didn’t give any real protection when the whole economy was in trouble.
The targeted shock of the 2022 rate cycle
If the 2008 crash showed us that equal-weighting isn’t a magic shield against big, system-wide financial panics, then the market swings in 2022 gave us a chance to see what equal-weighting is actually built to handle.
By the end of 2021, the S&P 500 had become more top-heavy than usual, with just five big tech companies making up almost a quarter of the whole index. These companies were trading at sky-high prices, thanks to years of super-low interest rates and a huge surge in tech spending during the pandemic. Because the index is built to follow market size, it ended up loading up on these expensive stocks right when they were at their priciest.
When central banks quickly raised interest rates to fight off high inflation, the market had to rethink what those big tech companies were really worth. Since higher rates make future profits less valuable, the prices of these growth stocks dropped fast.
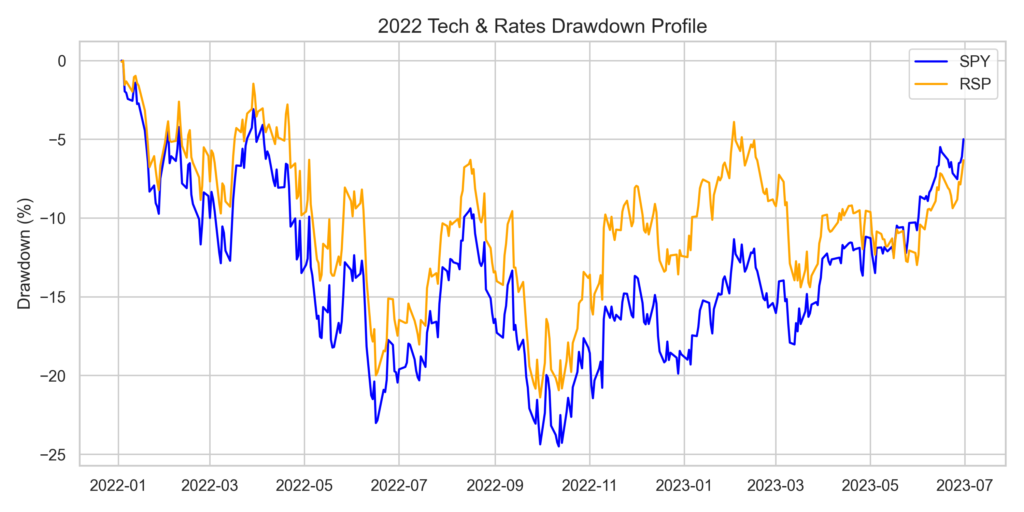
The market drop in 2022 wasn’t about the whole economy falling apart. Instead, it was mostly about those top five tech companies losing value all at once.
Since SPY is tied to market size, it got pulled down right along with those big tech names. If you look at the numbers for the 2022 and early 2023 period, you’ll see the story flips compared to 2008: SPY dropped by 24.5% from its highest point to its lowest, while RSP only fell by 21.4%.
If you look at the chart below, you can see how RSP (the orange line) held up much better than SPY (the blue line) all year long. While SPY investors had to ride out the rough drop in tech stocks, RSP investors went through a much gentler and easier-to-handle market dip.
At its core, the idea behind the equal-weight approach is pretty simple: by spreading investments evenly across all the companies in an index, you can help smooth out the wild swings that sometimes happen when one sector gets way too big and then suddenly drops in value. This method really shines when a single group of stocks, like tech companies, grows much faster than the rest and then faces a sharp correction, because equal-weighting keeps you from having too many eggs in one basket.
What happened with RSP is a good example of this in action. As the biggest tech companies soared in 2021, the equal-weight system kept trimming back those positions and spreading the money into other areas, like utilities, energy, and industrials. When tech stocks finally stumbled in 2022, RSP had already shifted a lot of its money into these more traditional businesses, which actually did well as the economy changed and investors moved away from growth stocks. In a way, the regular rebalancing acted like a built-in habit of taking profits from what’s hot and putting it into what might be next.
The volatility differential and the terminal cost of insurance
If we take a closer look at the rolling 3-year annualized volatility chart below, we can start to see what it really costs, over the long run, to hold onto this kind of protection against having too much of your money in just a few stocks. What stands out is that the orange line, which shows RSP’s volatility, often sits noticeably higher than SPY’s volatility, especially during times when the broader economy is calm and not much is happening.
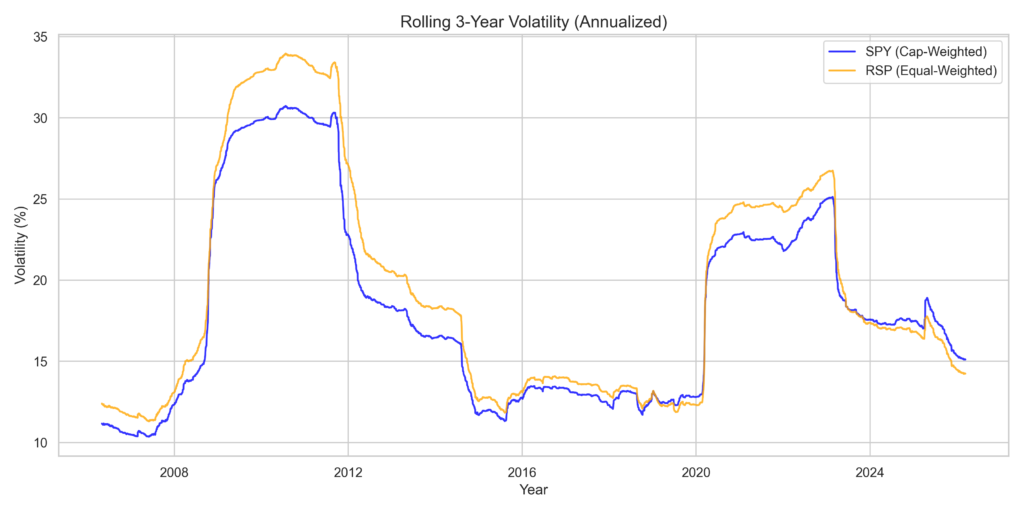
The reason you see more day-to-day swings with an equal-weighted fund is pretty simple: by spreading your money evenly, you end up taking a lot of it away from the biggest, most stable companies and putting it into the smaller ones that make up the bottom 200 of the S&P 500. These smaller companies tend to bounce around more in price, trade less often, and have bigger gaps between what buyers and sellers are willing to pay. So, when you use equal weighting, you’re naturally signing up for a portfolio that moves more like the mid-sized companies, rather than sticking close to the big names.
In a way, you’re always paying a kind of insurance premium against having too much money in just a handful of giant companies, but the cost is that your portfolio will jump around more every day. And if you take out the chance to ride the wave of fast-growing winners, you’re also giving up the possibility of those huge, long-term gains that come from letting the biggest success stories keep growing. Over a couple of decades, missing out on the compounding from those rare, runaway winners—like the tech giants we’ve seen lately—can really shrink your final results, and once that growth is gone, there’s no way to get it back.
So, it really comes down to whether paying that insurance makes sense for your own goals and how much risk you’re comfortable with. If you’ve already enjoyed years of strong growth from something like the SPY, putting new money into an equal-weight fund can work like a built-in safety switch, helping you avoid having too much tied up in just the biggest names. This way, you still get to own a wide mix of stocks, but you’re dialing down your exposure to those big, risky tech bets that are baked into the S&P 500 right now.
Equal weighting does a great job of protecting you if a bubble pops in just one part of the market, but it’s not a magic shield against big, market-wide crashes or global financial meltdowns. It can help you avoid getting hurt if the biggest companies stumble, but if everything takes a hit at once, you’re still along for the ride with everyone else.
References
[1] Asness, C., Frazzini, A., & Pedersen, L. H. (2019). Quality Minus Junk. Review of Accounting Studies.
[2] Fama, E. F., & French, K. R. (2008). Dissecting Anomalies. The Journal of Finance.
[3] S&P Dow Jones Indices. (2025). S&P 500 Equal Weight Index Methodology.
[4] yfinance Documentation and API data. (2026). Inception to 2026 historical data aggregation for SPY and RSP.

Leave a Reply