Disclaimer: The opinions expressed in this article are my own and do not represent the views of Google. This content is based solely on publicly available information.This content is for educational and entertainment purposes only. The author is not a financial advisor, and the content within does not constitute financial advice. All investment strategies and financial decisions involve risk. Readers should conduct their own research or consult a certified financial professional before making any financial decisions.
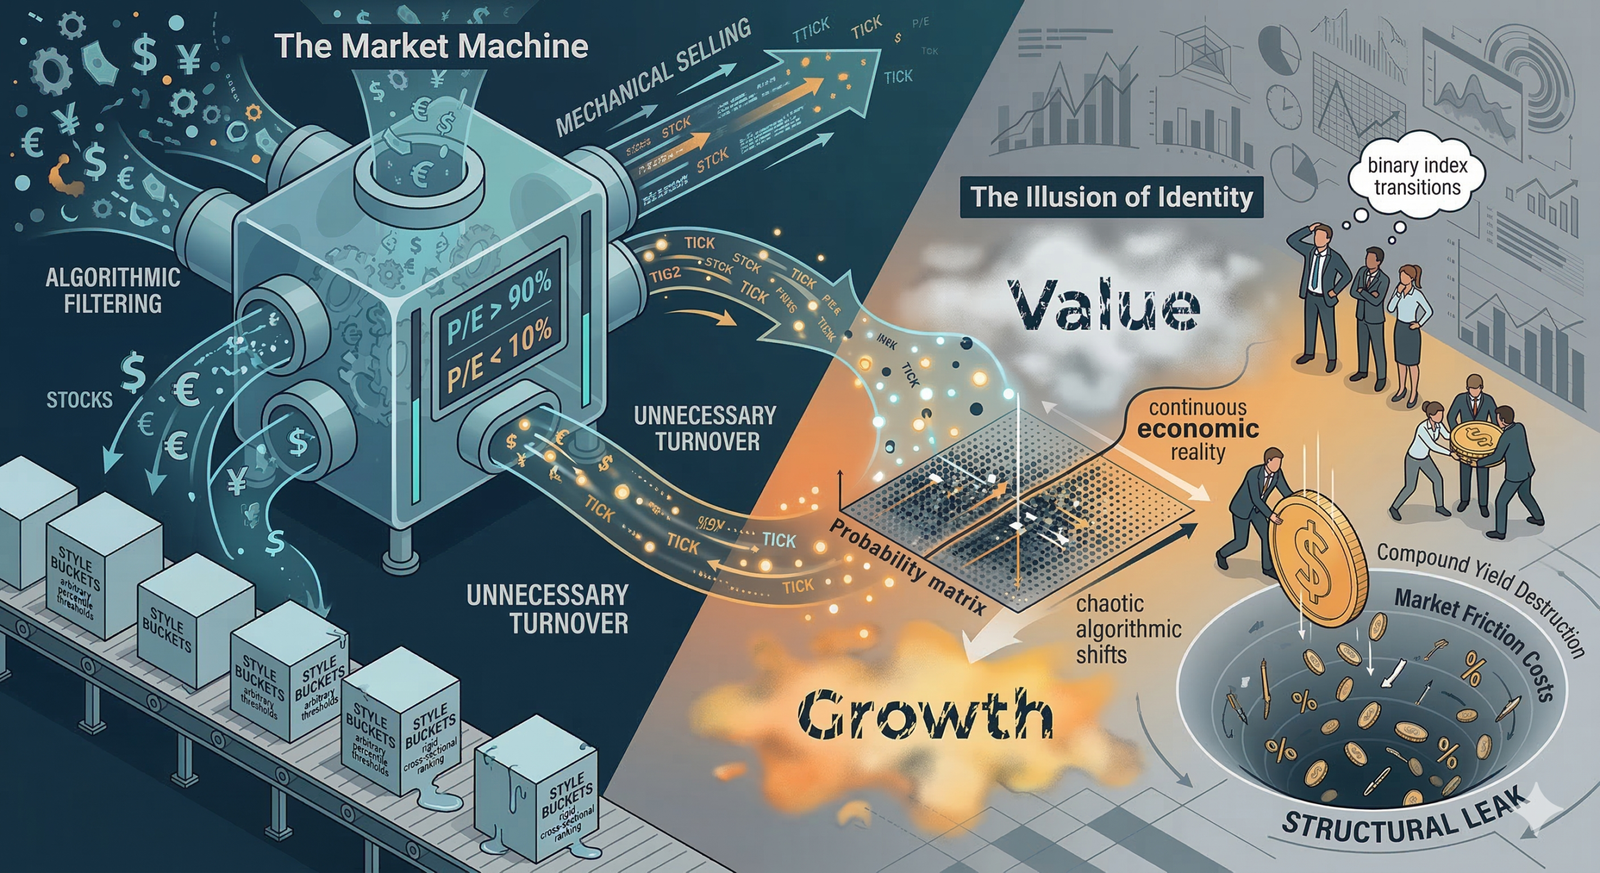
Index providers like to tell us that a company suddenly changes from ‘Value’ to ‘Growth’ the moment its price-to-earnings ratio crosses a certain line on a chart, as if something real and important has shifted inside the business itself. But if you stop and think about it, this idea doesn’t really hold up, even though huge amounts of money move around every day based on these labels.
If we look at how the market actually works, things get even stranger. Imagine a big tech company going through a normal dip in earnings, but its stock price stays high because lots of big investors are still holding on. Suddenly, its valuation numbers jump, and the index provider’s formulas notice this and move the company into a new category, just because it crossed a certain threshold. So, overnight, this huge business gets relabeled from Growth to Core, or Core to Value, even though nothing meaningful has really changed.
What happens next is that portfolio managers all over the world end up selling huge amounts of this stock, not because the company itself has changed or its profits have dropped, but simply because a formula in a spreadsheet told them to. We tend to accept this as just part of how factor investing works, trusting that the index providers have figured out some hidden truth about the market. But in reality, it’s much messier. These strict rules for sorting stocks force people to buy and sell for reasons that have nothing to do with the actual businesses, and all this unnecessary trading quietly eats away at returns.
The genesis of factor investing
If we want to figure out why this happens, it helps to rewind a bit and look at where the idea started. Back in the 1990s, two researchers named Eugene Fama and Kenneth French noticed something interesting: stocks that looked cheap compared to their book value often did better than the rest of the market over long stretches of time. Their research was solid, and what they found was that investors seemed to get paid a little extra for owning companies that were struggling or just not very popular at the time.
Once Wall Street got hold of this idea, they wanted to turn it into something they could sell to everyone, not just academics. To do that, they had to find a way to bundle the Value Premium into index funds and ETFs that anyone could buy. But since you can’t have a team of experts digging into every single company, they needed a simple, automatic way to sort all the stocks into ‘Value’ or ‘Growth’ buckets. So instead of relying on people to make judgment calls, they built a system that could do it all by itself.
The way they did this was by setting up some basic rules—just simple cutoffs based on numbers. It was really a shortcut that skipped over the messy details of how each business actually works, all so they could treat every company the same way. So when you look at these modern index funds, what you’re really seeing isn’t the original Value Premium in its pure form, but more of a rough, one-size-fits-all version that’s built to handle lots of stocks at once, even if it misses some of the finer points.
The illusion of categorization
If you really want to get a sense of just how inefficient this whole setup can be, it helps to zoom in and see how these indexes are actually built from the ground up. Companies like MSCI use a kind of two-dimensional grid to sort the market, and the main goal here is to give financial advisors a tidy set of boxes where they can place their clients’ investments without any overlap or confusion.
Behind the scenes, there’s a set of algorithms crunching numbers for all sorts of different factors. For stocks that are supposed to be ‘growth’ names, the system looks at things like how quickly their earnings per share are rising, both looking backward and forward, and how fast their sales are growing. For ‘value’ stocks, it’s more about how cheap they look compared to their book value, what their future earnings might be, and whether they pay out dividends. All these pieces get blended together into a single score for each company, and then the index provider lines up every stock in the market to see where they fit. The aim is to split the market right down the middle—half goes into the Growth bucket, half into Value. But if a stock doesn’t fit neatly into one side or the other, it can end up straddling both, which is where things start to get a bit messy.
This whole setup actually builds in a kind of weakness right from the start, because as stock prices naturally move up and down over time, they’re bound to bump into these hard lines the index has drawn. People in the industry call this ‘style drift,’ and while it’s usually seen as a mistake if a human fund manager suddenly switches from buying cheap industrial companies to chasing hot tech stocks, for an index, this drift isn’t a mistake at all—it’s just baked into the way the system works.
The tricky thing about how indexes work is that, while the real world moves in gradual steps, the index itself flips from one state to another as if someone just turned a switch. Companies don’t suddenly lose all their factories overnight or wake up with total control of their market, but the way the index is set up, it acts like these changes are instant and absolute. When it’s time to rebalance, the rules force you to make trades right away, just to keep up with whatever the latest version of the index says, even if that means ignoring things like taxes or whether the market is actually offering a fair price. The index only cares about sticking to its own rules, not about the messy details that real investors have to deal with.
Simulating structural style drift
I was curious to see just how much of the turnover we see in stock indexes is simply baked into the system, so I set up a simulation, tracking 500 stocks over 15 years, to get a sense of how much of this churn happens automatically, without any real-world events driving it.
To make the simulation feel realistic, I treated both earnings growth and valuation multiples as processes that tend to wander but eventually get pulled back toward a typical level, since in the real world, things like valuation can’t just drift off forever—they’re anchored by the way money moves toward better opportunities and away from overpriced stocks over time.
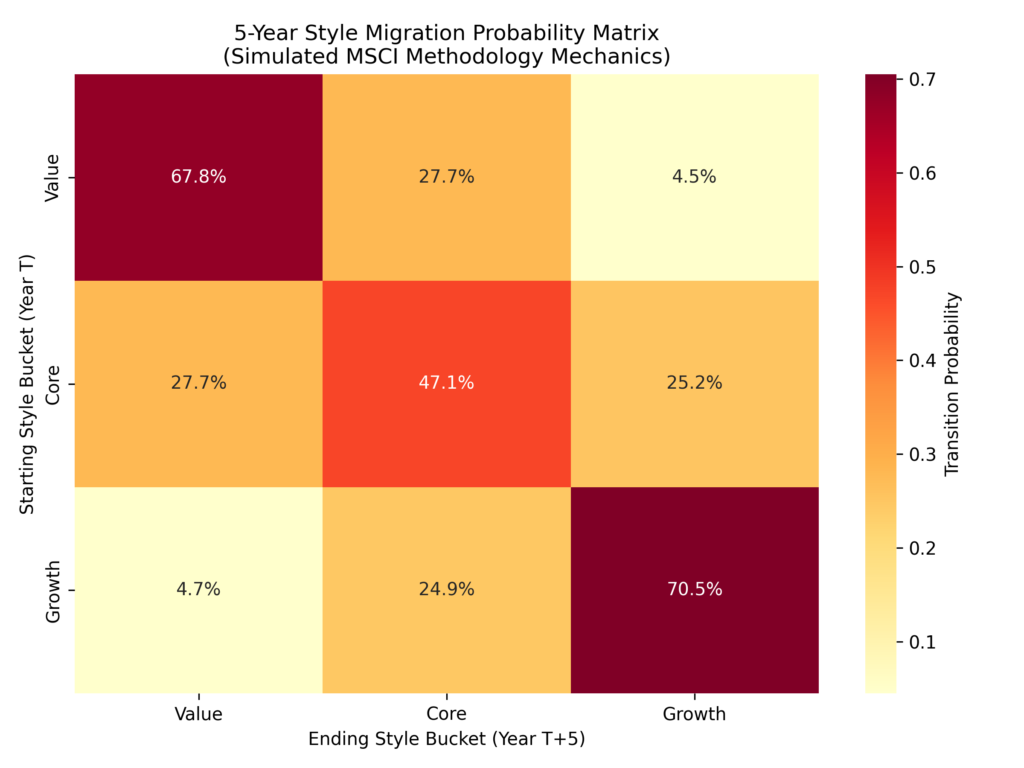
Once I had all this simulated data, I ran it through the same sorting rules that big index providers use: every year, I ranked the stocks and split them into three groups—Growth at the top, Value at the bottom, and Core in the middle. What I really wanted to see was how likely it is for a stock to move from Value to Growth over any five-year stretch, just because of the way the system is set up, without any outside events getting in the way.
What came out of the simulation was pretty striking: on average, about 17.5% of the stocks get reclassified every year, just because of the way the math works.
If you pause for a second, that’s almost one out of every five stocks in a style index getting shuffled into a new category each year—not because of bankruptcies, mergers, new technology, or companies suddenly expanding into new markets, but simply because of the way the sorting rules work.
To get a clearer picture of how much movement there really is, I pulled out a matrix showing the odds of a stock moving between categories over five years, and it turns out that a Value stock has about a 28% chance of ending up in Core and a 4.5% shot at making it all the way to Growth, while Growth stocks have a similar chance of sliding back into Core.
What really stands out in the matrix is how much of this movement is baked in: most stocks stay put, but there’s a steady stream of them being pushed into new buckets, just because of the way the system is designed.
The cost of arbitrary boundaries
What this matrix really shows is that when we divide stocks into these style buckets, we end up creating a lot of extra trading that doesn’t actually need to happen. This isn’t some accident or mistake in how the index works; it’s built right into the rules, and it’s something investors end up paying for directly. When you see a number like 17.5% annual turnover, it doesn’t mean that much of the market is actually changing in any meaningful way. Instead, it’s just the result of the index following a rigid rule, reacting to small, random changes that don’t really matter in the big picture.
If you look at a stock sitting at the 33rd percentile for valuation and compare it to one at the 34th, you’ll find they’re basically the same—they carry about the same amount of debt, generate similar cash flows, and deal with the same big-picture economic challenges. But because the index draws a hard line between these percentiles, even a tiny, random shift in the market can push a stock over that line, and suddenly the index has to trade just to keep everything sorted according to its rules.
Every time the index makes one of these automatic trades, it’s the investors who end up paying the price, whether that’s through the bid-ask spread or the extra costs that come from moving the market. And because high-frequency trading firms can see exactly when these trades are coming, they often jump in ahead of time, buying the stocks the index will need and selling the ones it has to drop, which means they’re taking a little bit from the fund with every rebalance. The index provider, meanwhile, doesn’t lose anything—they just keep collecting their fee, no matter how much these trading costs eat into the returns.
The original sin of price to book
Things get even trickier when you look at the specific numbers we use to sort companies into these categories, because the whole idea of value investing started with a heavy focus on the price-to-book ratio. Back in Benjamin Graham’s day, book value was a pretty straightforward concept, since it was all about real, physical stuff like factories, rail cars, inventory, and land—assets you could actually sell if a business ran into trouble and needed to pay off its debts.
But now, the things that really make a company valuable are often invisible on a balance sheet—think about algorithms, brand reputation, the power of a big network, or the skills and creativity of the people who work there. The way accounting rules work, if a company spends a lot on research and development, those costs usually get counted right away as expenses, which means the official book value looks lower than it probably should, and the price-to-book ratio ends up looking higher than it really is.
Because of this accounting oddity, companies that are actually very profitable and have strong competitive advantages often get left out of the Value category, while the Value indices end up filled with older, capital-heavy businesses that still own lots of physical stuff but might not be earning great returns.
So when a tech company eventually grows up a bit, slows down its big spending on new ideas, and starts giving money back to shareholders through things like dividends or buybacks, the numbers that define it start to shift. Suddenly, it moves from being labeled as a Growth company to being called Value, and the index funds just follow the formulas, trading shares back and forth without really noticing that the business itself has gone through a major change.
The momentum trap of style investing
Beyond the pure transaction costs, this mechanical methodology forces style indices into a structural momentum trap. They buy high and sell low by algorithmic design.
By definition, a stock enters the Growth index because its price and valuation multiples have expanded rapidly relative to its peers. The index is forced to buy the stock precisely at the moment its multiples are highest. Conversely, a stock enters the Value index because its price has collapsed faster than its book value or earnings. The index buys the stock precisely when it has maximum negative momentum.
When that Value stock eventually recovers and experiences multiple expansion, it drifts out of the Value bucket. The index is forced to sell it, capping its upside, and rotating the capital into a new, heavily beaten-down asset. The methodology systematically strips out the extreme winners perfectly.
The taxable consequence
If you are holding your money in a tax-advantaged account like an IRA or a 401(k), all this rapid trading mostly just acts as a hidden speed bump for your long-term returns, since the main costs you face are things like the difference between buying and selling prices and the way big trades can nudge the market around.
But if your money is in a regular taxable account, all this constant buying and selling can quietly eat away at your wealth, because every time a fund has to swap out a stock just because it no longer fits some statistical rule, the manager is forced to sell, and if there is a gain, that gets realized and passed on to you as a taxable event at the end of the year, whether you wanted it or not.
So in the end, you are basically footing the bill for short-term capital gains taxes just to keep a tidy statistical model running, even though that model does not really connect to what the companies are actually earning, and because these style rules are so strict, your money keeps getting shuffled around between nearly identical groups of stocks, all to support a story that financial advisors can use to explain why their asset allocation approach makes sense.
The engineering reality
Here’s something I’ve been thinking about: when we slice and dice investments into all these tiny categories, are we really getting enough benefit to make up for the constant churning that comes with it? If you look at the math, it turns out that just owning the whole market, without worrying about all those labels, leads to way less trading, lower costs, and usually just as good (or even better) long-term results after taxes. The reason is pretty simple—when you stop drawing lines inside your portfolio, you let everything work together smoothly, without all the extra friction.
If you look at how stocks move around over time, it becomes pretty clear that all these style labels are kind of made up, and keeping them in place actually costs a lot. The market doesn’t really fit into tidy boxes; it’s more like a messy, ever-changing river. When we try to force it into strict categories, we end up spending a lot—because in finance, all that effort shows up as trading costs, and those costs quietly eat away at your returns over time. So maybe it’s worth asking: why pay extra just to have someone keep sorting your investments into little buckets?
References
- “MSCI Value and Growth Indexes Methodology.” MSCI, 2023.
- Fama, Eugene F., and Kenneth R. French. “Value versus Growth: The International Evidence.” The Journal of Finance, vol. 53, no. 6, 1998, pp. 1975–1999.

Leave a Reply