Disclaimer: The opinions expressed in this article are my own and do not represent the views of Google. This content is based solely on publicly available information.This content is for educational and entertainment purposes only. The author is not a financial advisor, and the content within does not constitute financial advice. All investment strategies and financial decisions involve risk. Readers should conduct their own research or consult a certified financial professional before making any financial decisions.
If you only care about getting the biggest possible investment return, the math is actually pretty simple: you would just borrow as much as you can and put everything into stocks, then hang on for decades without ever flinching, no matter what happens in the world. In this scenario, you would ignore every scary headline and every market crash, trusting that, over time, stocks will keep compounding your money faster than anything else. The numbers say that adding bonds or cash to the mix will always slow you down in the long run.
But here’s the catch: this kind of perfect math doesn’t really help real people. Most of us just can’t stomach watching our life savings get cut in half during a big financial crisis, no matter what the textbooks say. When things get scary and the market tanks, it’s incredibly hard not to panic and sell at the worst possible moment, which is exactly how temporary losses can turn into permanent ones that take years to recover from.
So, if we want a portfolio that actually works for real people, we need to find a balance. The goal is to figure out how much safety we can add to smooth out the worst crashes, without giving up too much of the growth that makes investing worthwhile in the first place. It’s really about finding that sweet spot where you get the most out of both worlds.
One way to figure this out is to run the numbers for every possible mix of stocks and bonds, going back to 1996 and checking how each combination would have performed all the way up to 2026. By looking at these results, we can see exactly how much return you would have gotten for each level of risk and stress along the way.
To do this, we took thirty years of daily prices for the Vanguard 500 Index and the Vanguard Total Bond Market Index, and ran them through a custom Python script. We tested twenty-one different mixes of stocks and bonds, and tried out three different ways of rebalancing the portfolio. This let us cut through all the usual investing advice and see, in plain numbers, what actually worked best in the real world.
The hindsight benchmark: Defining “God Mode”
Before we can figure out the best way to split up our investments, we need to get clear on what we actually mean by a ‘perfect’ portfolio, at least when we look back at history. It turns out that just chasing the highest possible growth rate isn’t really the goal; instead, what we’re after is a kind of efficiency that shows up in numbers like the Sharpe ratio and the Sortino ratio, which are just ways to measure how much return you get for the amount of risk you take.
The Sharpe ratio is basically a way to see how much return you’re getting compared to how much your portfolio bounces around from year to year. If your Sharpe ratio is high, it means you’re getting a lot of return for each unit of risk, which is a good sign. The Sortino ratio takes this a step further by only caring about the bad kind of volatility—the kind where your investments drop in value—since nobody really minds when things go up unexpectedly. So, if you can build a portfolio that scores well on the Sortino ratio, you’re aiming for strong returns while doing your best to avoid those painful drops.
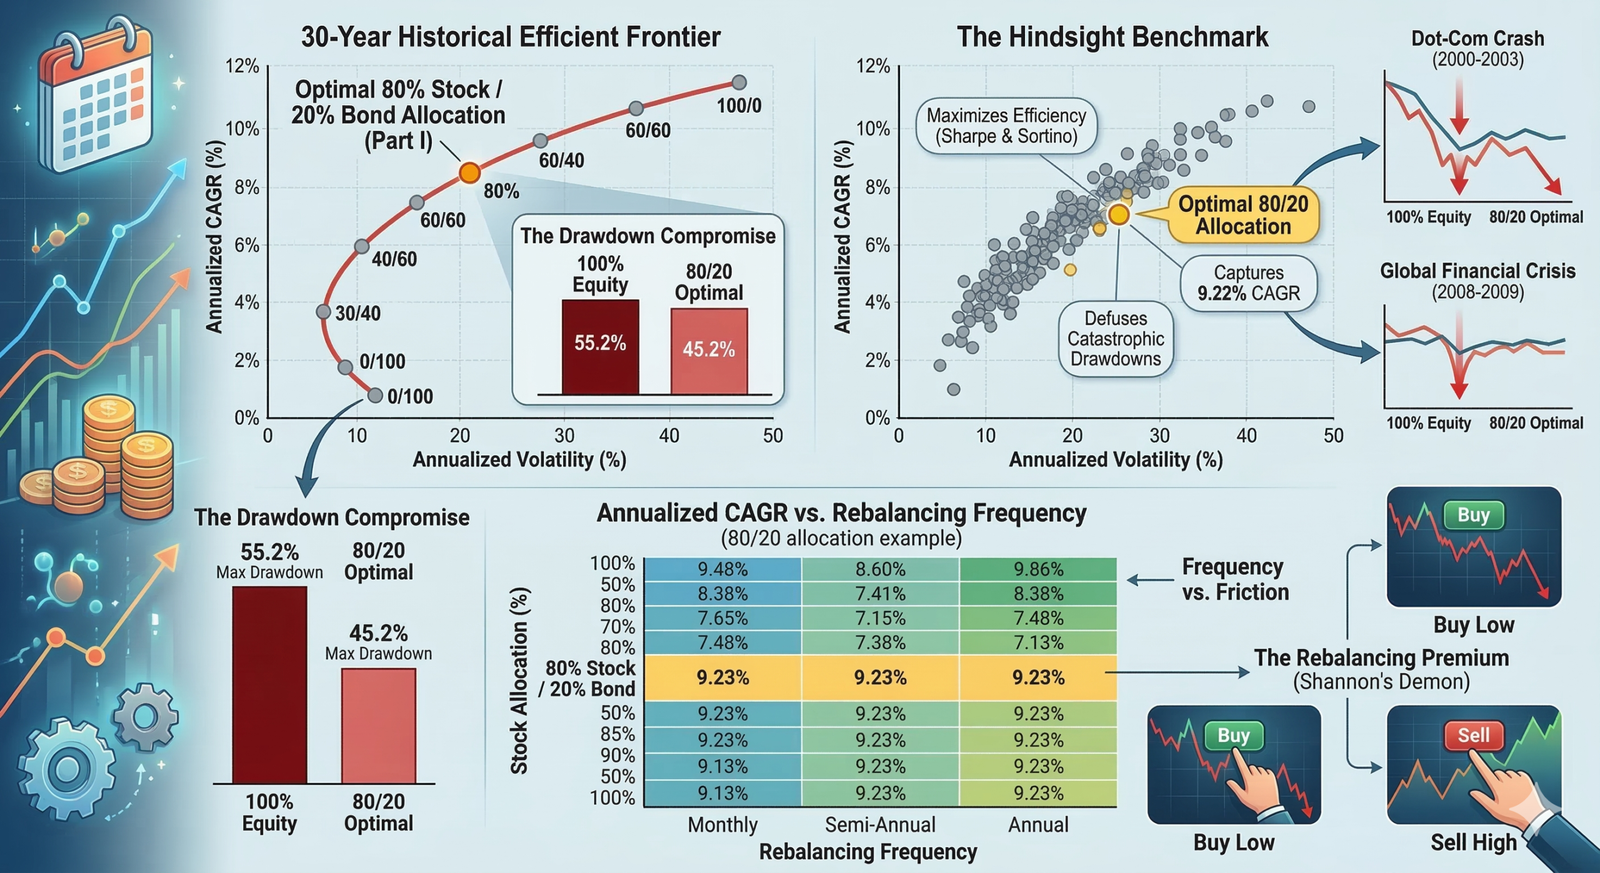
When I ran the numbers on all the different ways you could mix stocks and bonds, it turned out that the highest Sharpe and Sortino ratios didn’t actually come from the portfolios that chased the most growth. Instead, the best scores over the last thirty years showed up when you kept things really conservative, with just 15% in stocks and a whopping 85% in bonds.
This super-safe mix actually gave us a really impressive Sharpe ratio—1.19, which is quite high. But here’s the catch: even though the ride was incredibly smooth, with the worst drop being just 17%, the long-term growth was only about 5.2% per year, which just isn’t enough if you’re hoping to really grow your money over time. So, making things as safe as possible ends up holding back the very growth we’re trying to achieve.
If we’re looking for the sweet spot for someone who wants to build wealth over the long haul, we need to move up the risk ladder a bit and look for that point where you still have enough bonds to cushion the big drops, but not so many that you miss out on most of the stock market’s growth.
The numbers show that this balance happens right around an 80% stocks and 20% bonds mix. If you go all-in on stocks, you do get the highest average return—about 10.1% per year over thirty years—but you also have to stomach some huge drops, with the worst being more than half your portfolio disappearing at one point, and the ride is pretty bumpy overall.
But if you dial back just a bit and go with 80% stocks and 20% bonds, you still get a strong return—about 9.2% per year—which is only a little less than the all-stock approach. In return for giving up less than one percent of annual growth, you cut your worst loss by ten percentage points, and the overall ups and downs of your portfolio get a lot milder.
This kind of trade—giving up a tiny bit of growth to avoid a much bigger risk—is really what efficiency in portfolio design is all about. It’s the kind of balance that makes the whole thing work better for real people.
The practical implications of this efficiency crossover point dictate rWhat this really means in practice is that trying to squeeze out every last bit of return from stocks forces you to take on a lot more risk than most people can actually handle. If you go all-in on stocks for thirty years, you’re basically betting that you’ll never panic or need to pull your money out during a big crash. The numbers show that you don’t have to go to that extreme; you just need to find a smart middle ground that lets you grow your money without taking on more risk than you can realistically live with.
The anatomy of a drawdown
If you look at the scatter plot below, you’ll see a picture of how different portfolios might have performed over the past thirty years. Along the bottom, we’re tracking how much the value of each portfolio bounced around from year to year, while the side axis shows how quickly the money could have grown over time. Each dot is just a different mix of investments, moving up the risk ladder in five percent steps, so you can see how taking on more risk might have changed the results.
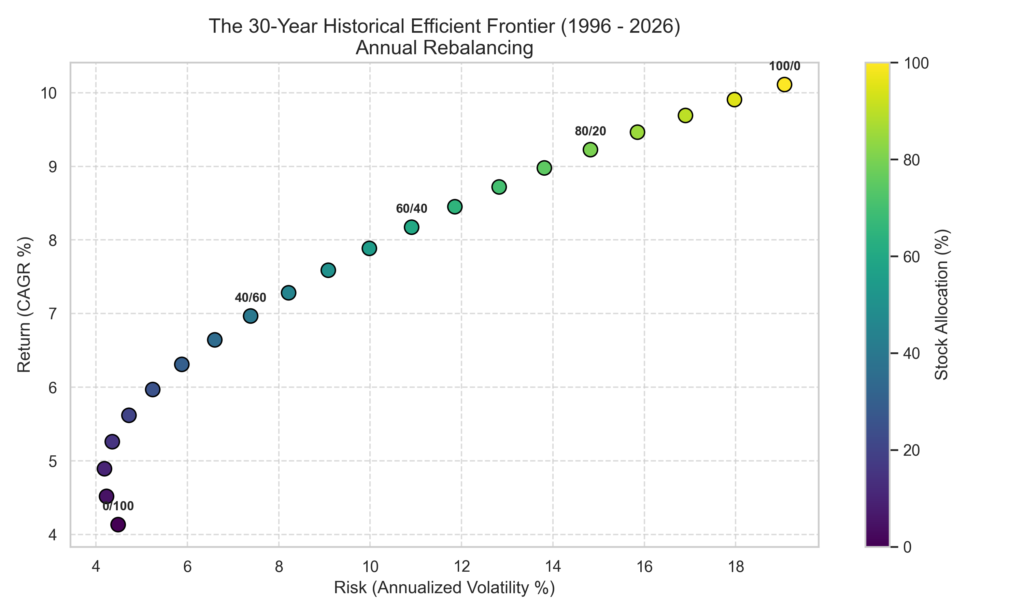
If you look closely at the chart, you’ll see that as you move past the classic 60/40 mix and start loading up on more stocks, the line showing your total return starts to flatten out, especially as you get closer to an all-stocks portfolio. The jump in risk you have to take on just to squeeze out that last little bit of extra return from 80/20 to 100% stocks is huge, and honestly, the trade-off just stops making sense at that point.
This extra risk isn’t just a technical detail—it really matters because of something called sequence of returns risk, which is just a fancy way of saying that if your investments take a nosedive right when you need to start spending your money, you can end up in real trouble. That’s exactly what happened in the early 2000s, when a lot of big funds got hit hard because they weren’t set up to handle that kind of timing.
Imagine someone who retired at the very start of 2000 with all their money in stocks. For the next three years, the Dot-Com crash wiped out tech companies and pulled the whole market down with it. If you had to pull out money for living expenses during that stretch, you’d be selling your stocks at the worst possible time, locking in those losses for good. Even if the market bounced back later, your portfolio would never fully recover because you’d already spent down your base.
But if that same person had gone with an 80/20 mix, things would have played out very differently. When stocks crashed, central banks cut interest rates, which actually made the bond part of the portfolio go up in value. That meant you could cover your living expenses just by using the bond side, leaving your stocks alone so they had a chance to recover. Having that 20% cushion in bonds gives you just enough breathing room to let the rest of your portfolio ride out the storm.
We saw the same thing happen again in 2008, when the financial crisis cut the S&P 500 in half. If you were all-in on stocks, your portfolio would have dropped by more than half, which led a lot of people to panic and sell at the worst possible moment. But with an 80/20 setup, the bond portion helped cushion the blow, so you didn’t have to take the full hit. The point of an 80/20 portfolio isn’t to win big when times are good—it’s to help you stay calm and hang on when things get rough.
The rebalancing premium (Shannon’s Demon)
At the heart of what makes this kind of portfolio work well is the simple math behind regular rebalancing. If you set up an 80/20 split between stocks and bonds and then just leave it alone for thirty years, the whole thing slowly falls apart.
Since stocks tend to grow faster than bonds over the long run, an 80/20 portfolio that you never touch will gradually drift until it looks more like 95/5, with almost everything in stocks. After twenty years, the safety net you started with is basically gone. To keep things balanced the way you planned, you need to step in every so often and bring everything back to your original mix.
When you pull your portfolio back to its original balance, you actually create a little extra return on top, which people call the ‘rebalancing premium.’ Claude Shannon, who was a famous mathematician, showed that you can get this bonus just by taking advantage of the ups and downs in the market.
Picture late 2008, when the financial system was in real trouble. The stock part of your portfolio, which started at 80%, has dropped so much that it now makes up just 65% of what you have left. Meanwhile, your bonds have held steady or even gone up a bit, so they now make up 35% of your total.
If you rebalance at the end of 2008, the numbers tell you to do something that feels completely wrong. You have to sell a big chunk of your safe, high-performing bonds right when they’re doing great, and use that money to buy more of the stocks that just lost so much value.
This is the classic case of buying low and selling high, even though it feels tough in the moment. By sticking to the plan, you’re taking money from the part of your portfolio that’s done well and moving it into the part that’s been beaten down, right before things start to bounce back.
If you keep rebalancing like this over thirty years, your portfolio ends up earning a little extra, and this bonus doesn’t depend on how well the companies themselves are doing. Instead, you’re just taking advantage of the way stocks and bonds move differently from each other over time.
The big insight here is that, with rebalancing, the ups and downs of the market stop being just a headache and actually become something you can use to your advantage. If you don’t rebalance, you just have to ride out the rough patches and hope your investments recover on their own.
But once you start rebalancing, those same market swings actually help you build wealth faster. The bigger the gap between how your stocks and bonds are doing, the more you can take advantage of it. By putting together something risky, like stocks, with something steady, like bonds, you’re able to scoop up extra returns from the way they move in opposite directions.
Frequency vs. friction
If we agree that regularly rebalancing your investments helps you stick to a plan and can give you a bit of an edge over time, the next question is how often you should actually do it. Is it better to rebalance every month so you can catch every little swing in the market, or is it smarter to do it less often so you don’t end up making a lot of extra trades?
To figure this out, I set up a simulation that looked at how different rebalancing schedules would have played out. I had a Python script keep track of every possible mix of stocks and bonds from 1996 all the way to 2026, and I tried out three different schedules: rebalancing every month, every six months, and once a year.
The heatmap below shows how each combination of stocks and bonds performed, depending on how often you rebalanced. It focuses just on the final annual growth rates, so you can easily compare what worked best for each schedule.
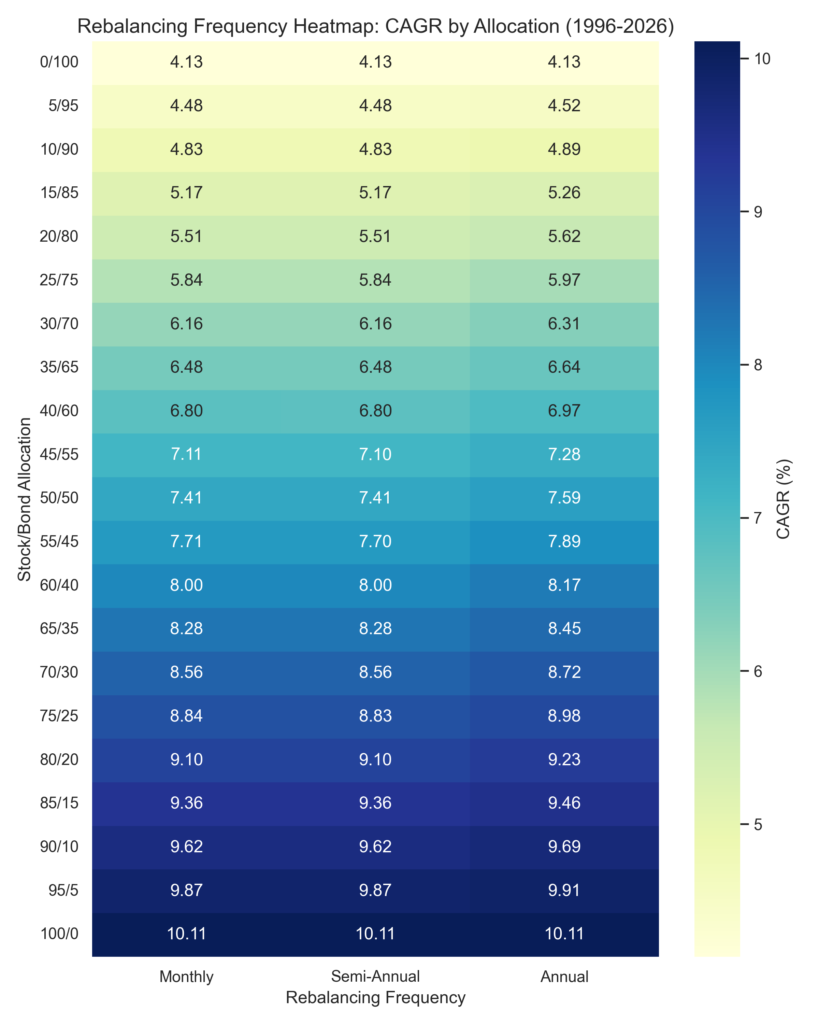
When you actually look at the results from running the numbers, it turns out that you really don’t need to rebalance your portfolio all the time. No matter what mix of assets you use, whether you’re mostly in bonds or you’re taking big swings with lots of stocks, the difference between rebalancing every month and just doing it once a year is basically nothing.
Take the classic 80/20 portfolio as an example. If you rebalance it every single month, you end up with a Compound Annual Growth Rate (CAGR) of 9.23%. But if you just check in once a year, maybe in December, and rebalance then, you get exactly the same 9.23%.
Sometimes you might see tiny differences in the results, but those are just random blips that come down to the luck of when the market happened to hit a low point compared to your rebalancing date. They don’t actually mean anything in the big picture.
This is a pretty big deal for anyone actually managing a portfolio. You do need to rebalance to keep your risk in check and make sure things don’t get too out of whack, but how often you do it doesn’t really change your long-term results in any meaningful way.
If you try to rebalance every month, you end up making a lot of trades, which can really add up in costs. In a regular taxable account, selling stocks that have gone up twelve times a year means you’re probably paying a lot of short-term capital gains taxes, which can eat away at your returns and leave you with less money than if you just left things alone.
Even if you’re using an IRA or a 401(k), where taxes aren’t an issue, having to check your account and do the math every single month is just a lot of extra work for not much benefit. The best results over the last thirty years have come from just picking your target mix, like 80/20, and only making changes once a year.
So, if you want to build the best possible portfolio, it really comes down to figuring out what to buy, making sure you’re set up to handle the tough times, and then having the patience to just leave it alone.
References
[1] Markowitz, H. (1952). Portfolio Selection. The Journal of Finance.
[2] Asness, C., Frazzini, A., & Pedersen, L. H. (2012). Leverage Aversion and Portfolio Choice. Journal of Political Economy.
[3] Shannon, C. E. (1956). Mathematics of investment. Bell System Technical Journal.
[4] yfinance Documentation and API data. (2026). Aggregate historical closing prices for Vanguard VFINX and VBMFX proxies across 1996 through 2026.

Leave a Reply