Disclaimer: The opinions expressed in this article are my own and do not represent the views of Google. This content is based solely on publicly available information.This content is for educational and entertainment purposes only. The author is not a financial advisor, and the content within does not constitute financial advice. All investment strategies and financial decisions involve risk. Readers should conduct their own research or consult a certified financial professional before making any financial decisions.
You can think of a market as a kind of machine that takes in all sorts of information and turns it into prices, but over the past ten years or so, we’ve been tinkering with that machine in ways that make it work a little differently than it used to.
People often talk about the growth of passive index funds as a big win for everyday investors, since it brought down fees and made it easier for more folks to get involved, but the thing is, every system has its own kind of balance, and when you take away the active investors who help figure out what things are really worth, you end up paying for it in other ways—right now, that price is showing up as a real drop in how easily you can trade the smaller companies in the S&P 500.
Active managers make trades based on their own research and unique insights, while passive funds just follow the flow of money into the index, and when new money comes in, it gets divided up in a pretty rigid way: the biggest companies like Apple, Microsoft, and Nvidia get most of it, while the smaller companies at the bottom of the list only see a tiny bit, which means those smaller stocks end up with less trading activity and bigger gaps between what buyers and sellers are willing to pay.
To see how this plays out over time, I put together a simple Python script that looks at daily trading volumes and the difference between buying and selling prices for both the biggest and smallest companies in the S&P 500, and when you look at the results, it’s pretty clear that as passive investing has grown, it’s made it much harder for the smaller stocks to stay liquid.
The necessity of price discovery
For financial markets to work well, they really need a steady flow of different opinions and perspectives, because that’s what helps everyone figure out what things are actually worth. This process, called price discovery, isn’t just some theory from an economics textbook; it’s something that happens in real life whenever buyers and sellers come together, each bringing their own information, guesses, and big-picture views to the table. The people we call active managers are kind of like the brains of this whole system, since they’re the ones sifting through all the data and turning it into the prices we see.
Passive funds, on the other hand, sort of ride along for free on this system, since they just use the prices that active managers have already worked out to decide where to put their money. The more money that moves into passive funds, the fewer active managers there are left to actually do the hard work of figuring out what things should cost, and as a result, the whole market starts to lose some of its sharpness and detail.
This loss of detail tends to hit the smallest companies the hardest, since the really big stocks are almost always being traded somewhere, whether that’s in a bunch of different ETFs, fancy quant strategies, or just regular people’s portfolios. But for the companies down at the bottom of the S&P 500, it’s a different story. If you’re a small industrial manufacturer hanging out at the edge of the index, you might find that the only big investors left holding your stock are the index funds themselves.
When active managers decide to move on because a stock just isn’t exciting or volatile enough to bother with, trading in that stock can dry up almost completely. What ends up happening is that the stock just sort of drifts along quietly, only really moving when the index itself gets shuffled around, instead of responding to what’s actually happening in the business. At that point, it’s like the whole process of figuring out what the company is worth just shuts off.
Bid-ask spread widening
When we talk about liquidity in a financial asset, what we really mean is how much money you can move in or out before the price starts to budge, and the best way to get a sense of that is by looking at the bid-ask spread. If market makers see lots of steady trading, they feel comfortable keeping that spread tight because they know they can quickly buy or sell what they need. But when trading slows down, it gets riskier for them to hold inventory, so they widen the spread to protect themselves from getting stuck with something they can’t easily sell.
To get a feel for how this actually plays out, I looked at ten years of data, comparing the biggest stocks in the S&P 500 to the smallest ones. Because it’s tough to find clean, historical records of bid-ask spreads going back that far, I used a common method from market research to estimate the spread, which basically means taking the recent 60-day volatility and dividing it by the square root of the average trading volume over the same period. I used numbers from 2016 as a starting point to keep things consistent.
Back in 2016, things looked pretty normal: smaller stocks cost a bit more to trade, but everything was steady. Fast forward past the pandemic, though, and as more money started flowing into passive index funds, the gap between big and small stocks really started to open up. The largest companies kept their spreads incredibly tight and their trading volumes huge, while the smallest stocks saw their trading activity slowly dry up compared to where they started in 2016, which meant their estimated spreads just kept getting wider.
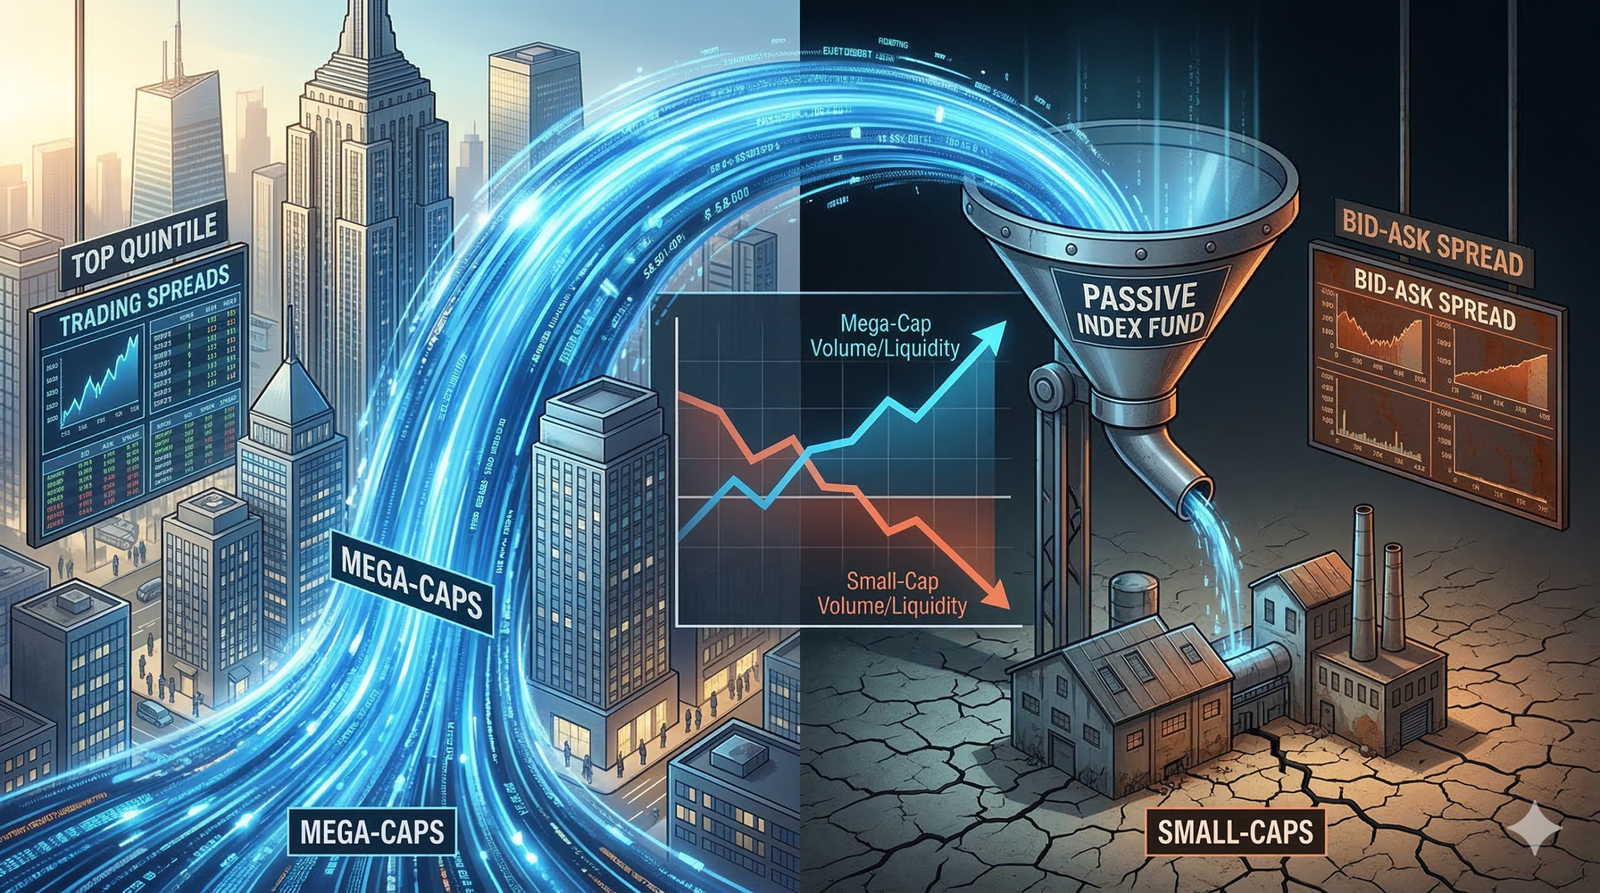
You can see this story play out in the two charts below: the first one shows how trading volume for the smaller stocks has faded over time, while the second one makes it clear that their estimated bid-ask spreads have widened, even as the biggest stocks barely budge from their tight, near-zero spreads.
If you look at this chart, you can really see what I mean by the passive paradox, because the very thing that makes index funds so popular is also making it harder and harder to actually trade the stocks that are struggling the most inside those indexes.
The cost of liquidity decay
Wider spreads and lower trading volumes aren’t just interesting details for academics; they actually make it much more expensive and difficult for anyone who wants to buy or sell these companies outside of the big index funds.
Imagine an active manager spots a great comeback story in one of the smaller S&P 500 companies and wants to buy in. Back in 2016, buying enough shares to make up 2% of their portfolio might have nudged the price up by about 0.15%. Now, because there just aren’t many shares available to trade, that same order could push the price up by 0.8%. The extra cost of getting into the trade eats up any potential gains, so the manager decides it’s just not worth it and moves on.
This decision not to trade sets off a cycle where things just get worse: since the manager stays out, trading volume drops even more, which leads market makers to make the spread even wider, and the price drifts further away from what the company is actually worth.
For companies sitting at the bottom of a big index, things get a bit strange. They still get money flowing in from retirement accounts that automatically buy the S&P 500, but their daily share price doesn’t really tell you much about how the business is actually doing. Instead, the price mostly just follows whatever the overall market is doing. Even if the company suddenly reports much better earnings, there might not be enough active investors or easy trading to make the price move in response, so the real story gets drowned out by all the background noise from passive investing.
This slow loss of liquidity also makes it much harder to get out when things go wrong. If something big happens and lots of people want to pull their money out of index funds at the same time, those funds have to sell everything in proportion. Selling Apple shares is no problem, but trying to sell a less-traded industrial stock that hardly anyone has touched in years could send its price tumbling in an instant. On the surface, it looks like everything is liquid, but underneath, things are actually pretty fragile.
The whole setup works really well for bringing in money during good times, but we haven’t really seen what happens if everyone tries to get out at once and there aren’t enough buyers. We’ve built a system where the index seems easy to trade, but the stocks underneath are getting harder and harder to move. If the market suddenly needs to adjust prices quickly, all these hidden liquidity problems could show up at the same time.
References
[1] O’Hara, M. (1995). Market Microstructure Theory. Blackwell Publishers.
[2] Corwin, S. A., & Schultz, P. (2012). A Simple Way to Estimate Bid-Ask Spreads from Daily High and Low Prices. The Journal of Finance, 67(2), 719-760.
[3] Amihud, Y. (2002). Illiquidity and stock returns: cross-section and time-series effects. Journal of Financial Markets, 5(1), 31-56.
[4] Historical Market Data via yfinance (2016-2026).

Leave a Reply