If you read the headlines, you might get the impression that the stock market moves as one big, unified machine—especially when the S&P 500 hits a new high and everyone starts celebrating. But if we look a little closer, what we actually see is a whole network of different parts, each with its own quirks and issues, and not all of them are running smoothly. The big tech names like Nvidia and Microsoft have been doing most of the heavy lifting since 2022, but there’s another, less obvious signal coming from a different part of the market: the Russell 2000.
People like to call the Russell 2000 the ‘canary in the coal mine’ for the US economy, and I think that’s a pretty good way to think about it. While the S&P 500 is full of global giants with deep pockets and strong balance sheets, the Russell 2000 is made up of smaller, mostly domestic companies that rely a lot more on borrowing—and that makes them much more sensitive to changes in interest rates. By end of 2025, you can see signs of stress showing up in this index that might look familiar to anyone who has ever tried to keep a complicated system running smoothly. Even though the Russell 2000 has bounced back in price and is almost back to where it was in 2021, the basics underneath tell a different story. Nearly 40% of these companies are losing money, and a huge chunk of their debt is about to come due at higher rates. So instead of being a simple investment, the Russell 2000 is starting to look more like a warning sign for the whole financial system.
So let’s set aside all the buzzwords like ‘catch-up trades’ and ‘value rotation’ for a minute, and try to look at the Russell 2000 the way an engineer might look at a bridge or a building. We’ll dig into what actually makes up this index, see how much it swings around compared to the bigger companies, walk through what happens when all that debt comes due in 2026, and try to figure out whether small caps are about to bounce back—or if they’re actually showing us a deeper problem in the market.
The Architecture of the Russell 2000
Before we can spot the warning signs, it helps to know what we’re actually looking at. The Russell 2000 isn’t just a random grab bag of small companies—it’s made up of the bottom two-thirds of the Russell 3000, which itself covers almost the entire US stock market. If the S&P 500 is a list of the big winners who have already made it, the Russell 2000 is more like a group of up-and-comers still trying to find their place. We’re talking about companies worth anywhere from $300 million to $2 billion, including everything from regional banks and biotech startups that haven’t sold a product yet, to small manufacturers and retail chains still fighting for a spot in the mall.
What really sets the Russell 2000 apart isn’t just that the companies are smaller—it’s that the quality of those companies is all over the map. The S&P 500 has a kind of gatekeeper: you have to show steady profits to get in. The Russell 2000 doesn’t have that filter. If you’re small enough and your stock trades enough, you’re in, no matter how your business is actually doing. That means the index ends up with a mix of fast-growing newcomers and companies that are struggling, all thrown together in one big basket.
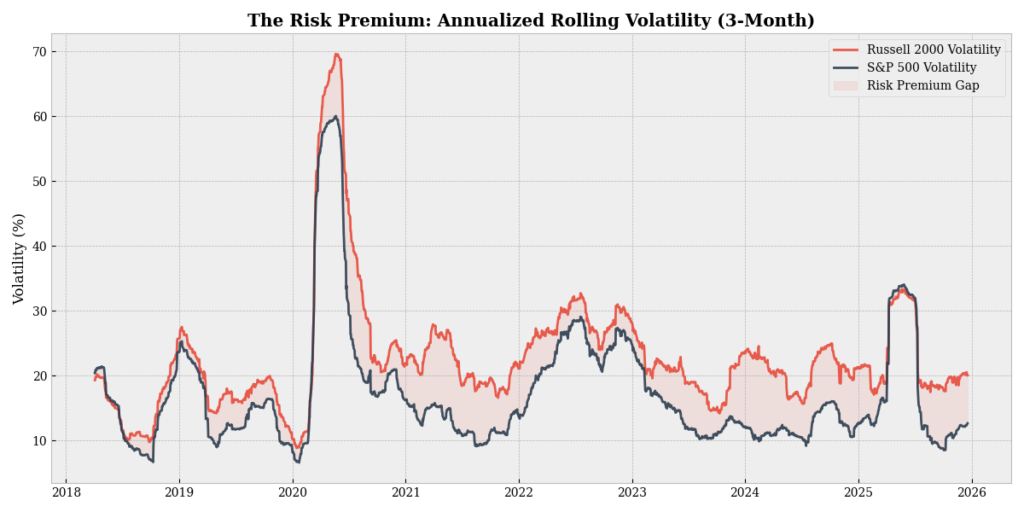
Because there’s no quality filter, the Russell 2000 ends up being a lot more jumpy than the big-cap indexes. When I looked at the last five years, I found that the Russell 2000’s ups and downs are about 60% bigger than what you see in the S&P 500. In plain English, that means small caps are a much wilder ride. If you buy into the Russell 2000, you’re not really getting the steady, slow-and-steady growth of the whole US economy—you’re making a much bigger bet on how quickly things are changing at the edges.
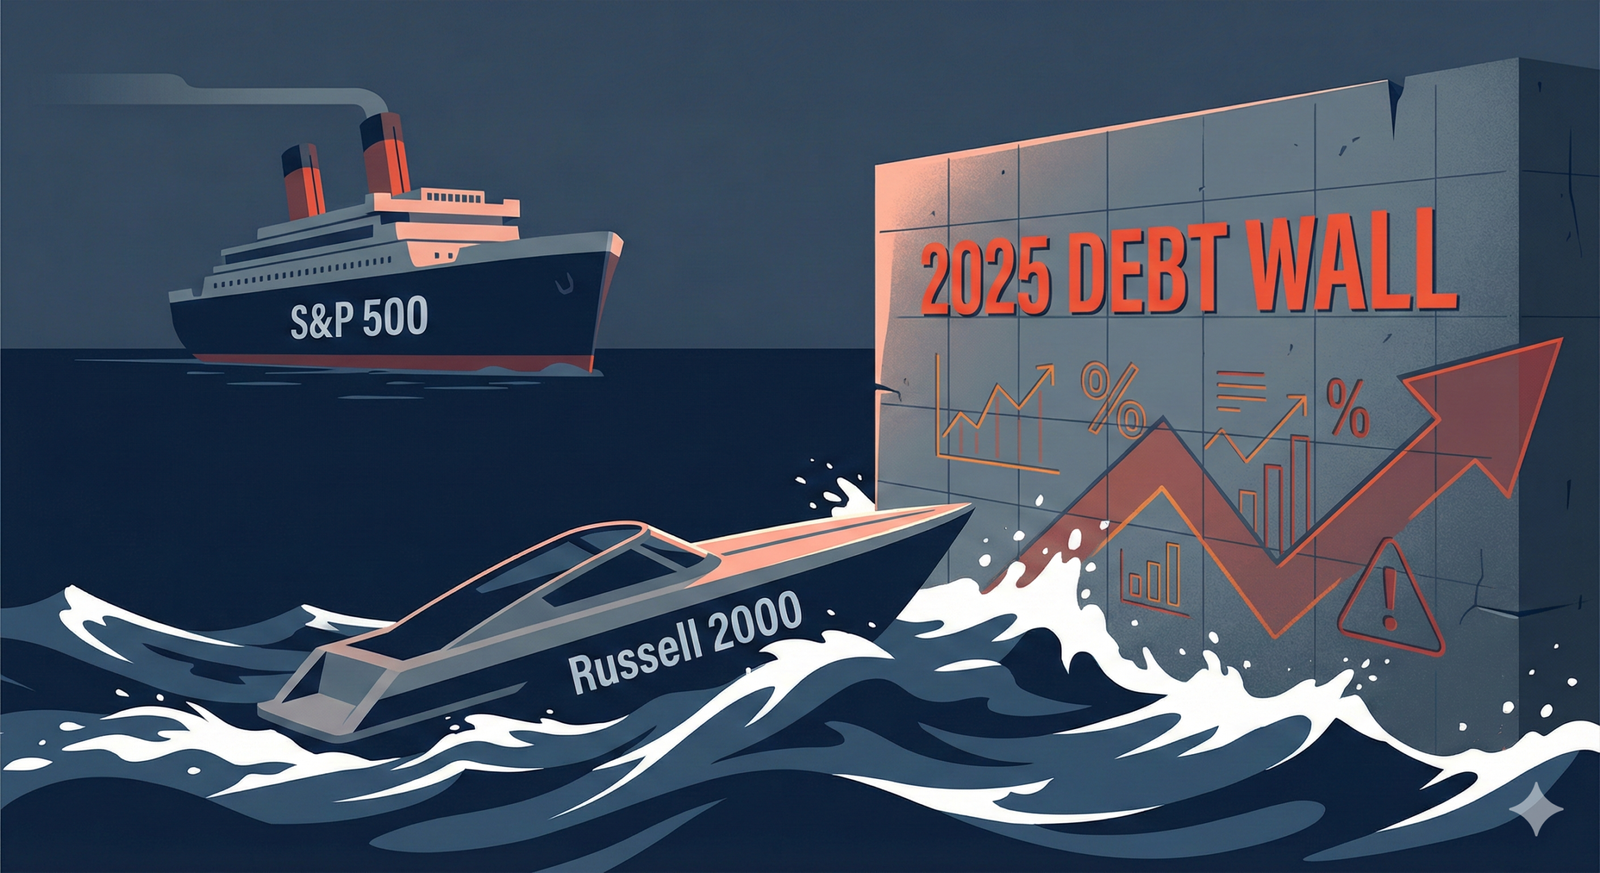
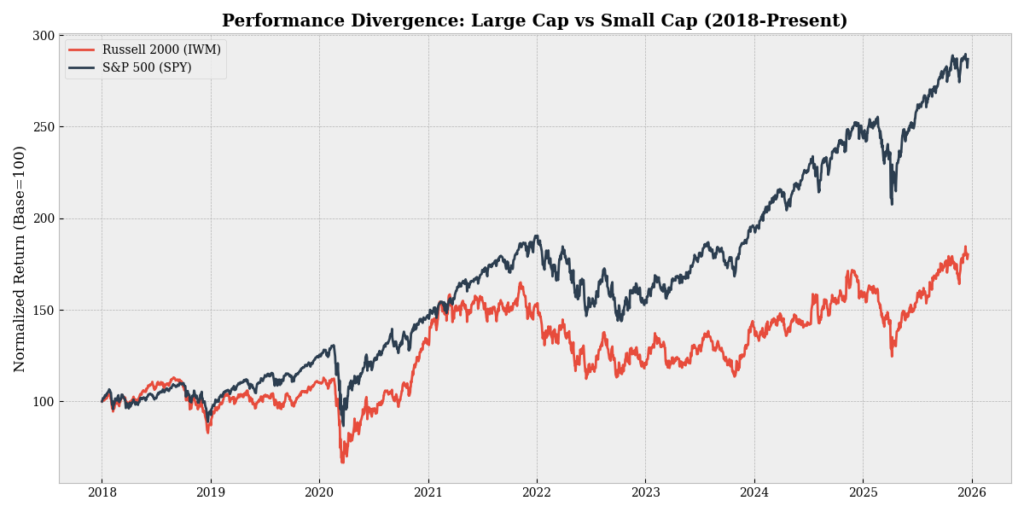
Normally, you’d expect investors to get paid more for taking on all that extra risk, but over the last ten years, it’s actually been the opposite—the S&P 500 has left the Russell 2000 in the dust. You can see the differences in both performance and volatility in the figure below. This isn’t just a fluke or a mood swing; it’s because the cost of borrowing has changed so much. Small caps are kind of like speedboats: they can zip around quickly when the water is calm and rates are low, but they’re also the first to tip over when things get rough. The big companies are more like giant ships—they might be slow to turn, but they can handle a storm. And 2026 is looking more and more like a stormy year for anyone who needs to refinance their debt.
The Zombie Problem: 42% Unprofitable
The most alarming metric regarding the Russell 2000 is not its price-to-earnings ratio, but rather the fact that for a massive chunk of the index, the “earnings” part of that ratio does not exist. As of late 2025, approximately 42% (40% to 43% depends of different sources) of Russell 2000 companies were unprofitable. Roughly four out of every ten companies in this index effectively light money on fire to stay warm.
In 1995, the percentage of unprofitable companies in the Russell 2000 was closer to 15%. This structural shift towards unprofitability is a feature, not a bug, of the post-2008 Zero Interest Rate Policy (ZIRP) era. For over a decade, capital was free. When the cost of debt is near zero, a company does not need to generate free cash flow to survive; it only needs to put together a convincing PowerPoint deck to refinance its loans. This environment fostered a generation of “Zombie Companies”—firms whose operating profit (EBIT) is insufficient to cover their interest expenses.
These zombie companies are only still around because they can keep borrowing. As long as they can get new loans to pay off the old ones, they can keep the lights on and pay their employees, but they’re not really building anything new—they’re just using up resources. In a healthier system, these companies would go out of business, making room for new ones to grow. But because money has been so easy to get, we’ve ended up with a lot of dead wood piling up, just waiting for a spark.
Now, look at the composition of these unprofitable firms. It is heavily skewed towards Biotechnology and Technology. In the Russell 2000, a biotech company might have a $500 million market cap based entirely on the probability of a single Phase II drug trial. If the trial succeeds, the stock triples. If it fails, it goes to zero. This distribution of binary outcomes pulls the index average down. But even removing biotech, the number of unprofitable industrial and consumer firms is historically high. This is the “warning sign” flashing red. When 40% of an index cannot self-fund, that index is not an investment in corporate earnings; it is an option on the availability of credit. If the credit window closes, or even if it just becomes expensive, the mortality rate of these companies will spike.
The Refinancing Wall
The big problem facing the Russell 2000 in 2025 is what people call the ‘maturity wall.’ Unlike a 30-year mortgage, most corporate debt only lasts three to seven years before it has to be paid back or refinanced. A huge chunk of the debt that companies took on when rates were low in 2020 and 2021 is coming due soon—over $600 billion worth. This is where the difference between big and small companies really matters. The giants in the S&P 500 locked in low rates for a long time, so they’re still paying 2020 prices for their debt, even though rates have gone way up. They’re basically insulated from the storm, at least for now.
But smaller companies in the Russell 2000 didn’t have that option. They usually can’t get long-term, fixed-rate loans, so they end up with shorter-term or floating-rate debt. About 30% of their debt changes with interest rates, compared to less than 10% for the big companies. That means every time the Fed raises rates, these smaller companies feel it right away in their monthly bills.
Let’s simulate the mechanics of this value trap. Imagine a typical small manufacturing firm in the Russell 2000—let’s call it “Acme Widget Co.” Acme has $100 million in debt. In 2021, they paid a 4% interest rate (2% base + 2% spread). Their annual interest expense was $4 million. If they had $6 million in EBIT, they were profitable. Coverage ratio: 1.5x. Fast forward to 2025. Acme has to refinance that $100 million and the base rate is now closer to 4.5% or 5%, and because credit conditions are tighter, their spread might widen to 400 basis points. Their new rate is 8.5% or 9%. Suddenly, their annual interest expense jumps from $4 million to $9 million.
Remember, Acme was only earning $6 million before interest. With the new, higher rates, they’re now losing money just because their debt got more expensive. Suddenly, they’re a zombie company. And this isn’t just a one-off—it’s happening to hundreds of small companies in the index. Their ability to pay interest out of earnings is dropping fast, while the big companies are still in great shape. That’s why the S&P 500 can handle higher rates, but the Russell 2000 is having a much tougher time.
Even with all these challenges, there’s a different story making the rounds in late 2024 and 2025—the ‘coiled spring’ idea. The thinking goes like this: small caps have done so badly for so long that all the bad news is already baked into their prices. If you ignore the unprofitable companies for a second, the rest of the Russell 2000 is trading much cheaper than the big names in the S&P 500. The optimists say that if the Fed starts cutting rates in 2025, suddenly all that floating-rate debt won’t look so scary, money will start flowing back in, and small caps could bounce back in a big way. We actually saw a taste of this in late 2024, when just the rumor of rate cuts sent small caps soaring during the ‘Everything Rally.’
Small caps are also more tied to what happens in the US economy. If we get that ‘soft landing’ everyone is hoping for—where growth keeps going and we avoid a recession—these smaller, domestic companies could see their earnings grow even faster than the big multinationals, who have to deal with things like currency swings and global politics. Some analysts are even predicting over 30% earnings growth for the Russell 2000 in 2025, just from bouncing back after a rough patch. If that actually happens, today’s prices could look like a steal. But it’s a classic trade-off: the S&P 500 is like a well-padded safety net—expensive, but sturdy. The Russell 2000 is lean and cheap, but there’s no room for mistakes. If the economy keeps humming, small caps could take off. If things go sideways, or if inflation sticks around and the Fed can’t cut rates, small caps could run into real trouble.
Where the Risk Resides
To truly understand the Russell 2000’s fragility, we must perform a component analysis. The index is not a homogeneous block; it is a weighted average of disparate sectors with vastly different sensitivities to the macro variables we have discussed. The lazy analysis says “small caps are cyclical.” The rigorous analysis asks: “Which small caps?” The single biggest distortion in the Russell 2000 comes from the Healthcare sector, which makes up nearly 16% of the index. In the S&P 500, Healthcare means Johnson & Johnson or UnitedHealth—cash-printing machines with dividends. In the Russell 2000, Healthcare is predominantly pre-revenue Biotechnology and Pharmaceuticals. These are R&D labs with stock tickers. They burn cash by design. When we cite the “42% unprofitable” statistic, a significant portion of that comes from this sector. However, excluding them does not solve the problem; it merely isolates the pathology. Even after stripping out the biotech lottery tickets, we see rising distress in the Industrial and Consumer Discretionary sectors (together accounting for nearly 30% of the index).
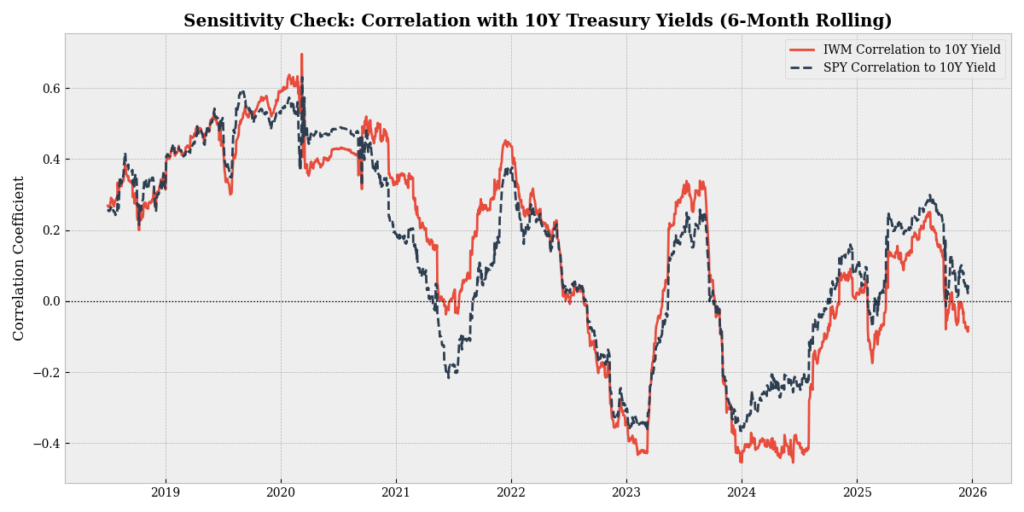
The Industrial components—small machinery manufacturers, trucking firms, aerospace suppliers—are the ones most exposed to the “Old Economy” input costs: labor, diesel, and steel. These firms typically operate with thin net margins, often in the single digits. A 200-basis-point increase in their interest expense, combined with a 10% wage hike due to sticky inflation, can wipe out their bottom line entirely. Unlike Microsoft or Meta, they have no pricing power to pass these costs on to consumers indefinitely. Reliability engineers would call this a system with “no slack.” The Regional Banking sector (Financials are ~17% of the index) is another critical fault line. These banks are the primary lenders to the other Russell 2000 companies which is a recursive risk loop. If the small industrial firms default on their floating-rate loans, the regional banks take the hit. If regional banks pull back on lending to preserve capital (as they have been doing since the Silicon Valley Bank collapse), small industrial firms lose their liquidity lifeline. This feedback loop is the mechanism by which a “soft landing” can rapidly turn into a localized “hard landing” for the small-cap ecosystem, even while the S&P 500 barely notices. This distinct vulnerability is clearly visible in the sensitivity check below which plots the rolling correlation with 10-year Treasury yields, illustrating how the small-cap index (I usded IWM ETF) reacts much more violently to rate changes than its large-cap counterpart (I used SPY ETF) that remains relatively insulated from these shifts.
Three Futures for 2026
Instead of trying to predict the future, I like to think in terms of possible scenarios—just like an engineer would. When I’m looking at how much to invest in small caps right now, I see three main paths the next couple of years could take:
- Scenario A: The “Immaculate Soft Landing”
- Scenario B: The “Stagflation Grind”
- Scenario C: The “Hard Landing” Flush
In scenario A, inflation quietly returns to 2% without a spike in unemployment. The Federal Reserve cuts rates aggressively—bringing the Fed Funds rate down to 3% by mid-2026. This is the “Goldilocks” outcome. The floating-rate debt burden on Russell 2000 companies evaporates as interest expenses fall. The valuation gap closes rapidly, and small caps outperform large caps by 15-20% over a 12-month period. This is the “Coiled Spring” releasing its energy.
In Scenario B Inflation proves sticky, hovering around 3-4% due to deglobalization and fiscal deficits. The Fed is forced to keep rates “higher for longer,” perhaps settling at 4.5%. This is the worst-case scenario for the Russell 2000. It is the “Death by a Thousand Cuts.” The debt maturity wall hits fully. The 40% of zombie companies cannot refinance and begin to fail or are taken private at distressed valuations. The index treads water or slowly bleeds value while the S&P 500 continues to compound, widening the performance gap to historic levels.
In the third scenario, all the rate hikes finally break something in the real economy—maybe commercial real estate or consumer loans—and we end up in a recession. The Russell 2000 would probably fall the hardest and fastest, maybe dropping 30% or more as money dries up. But this is also the ‘forest fire’ scenario: the weak companies go under, the Fed slashes rates, and for anyone with cash on hand, it could be a once-in-a-decade chance to buy the survivors at bargain prices before the next upswing.
Conclusion
The Russell 2000 in 2025 is not a place for passive “index and chill” investing. It is a minefield where the difference between a 2x return and a 0x return is defined by balance sheet management. The 40% of the index that loses money makes the aggregate index a poor investment vehicle. You are effectively diluting your winners with hundreds of losers. However, this dispersion creates a paradise for active selection. The “Warning Sign” I’m highlighting—the debt wall and the lack of profitability—does not apply to every small cap. There are high-quality small companies with low debt and niche moats that are being thrown out with the bathwater. They are trading at valuations not seen since 2008 because the passive flows into “Small Cap ETFs” are selling everything indiscriminately. For the sophisticated investor, the play is not to buy IWM (the ETF) and hope for a Fed bailout. The play is to apply the “quality filter” that the index lacks. Look for small caps with:
- Fixed-rate debt profiles: Companies that termed out their debt in 2021 and don’t face the 2025 wall.
- Positive Free Cash Flow: Real cash, not just “Adjusted EBITDA.”
- Low Beta to Interest Rates: Businesses whose demand is inelastic to the cost of money (e.g., specialized defense contractors, essential healthcare services).
The Russell 2000 is flashing a warning, but also an opportunity. The warning is that the era of easy money is over, and the zombies are going to die. The opportunity is that the market hasn’t figured out which ones are the zombies and which ones are the survivors. Structural volatility usually precedes a phase transition. We are in that transition now. Tread carefully, check the balance sheets, and don’t assume that a rising tide will lift the boats with holes in them.
References & Data Sources
- J.P. Morgan Asset Management, “Guide to the Markets – U.S. 4Q 2025”. (Data regarding the 42% non-earner metric and historical comparisons to 1995/2000).
- Apollo Global Management, “The Rise of the Zombie Firm in the Russell 2000”, Daily Spark, September 2025. (Source for the “Zombie Company” analysis and EBIT vs. Interest Expense coverage ratios).
- FactSet Earnings Insight, “Small Cap Sector Margins and Profitability Trends”, November 2025. (Source for sector-specific unprofitability in Biotech and Industrial sectors).
- Goldman Sachs Global Investment Research, “US Small Cap Debt Maturity Wall: 2025-2029”. (Source for the $600 billion maturity figure and floating vs. fixed rate debt breakdown).
- Bloomberg Fixed Income Data, “Corporate Debt Structures: S&P 500 vs. Russell 2000”, retrieved December 2025. (Data regarding the 30% floating rate exposure for small caps vs. <10% for large caps).
- S&P Dow Jones Indices / FTSE Russell, “Index Dashboard: Volatility and Risk-Adjusted Returns”, December 2025. (Source for the 5-year volatility comparison and historical underperformance data).
Disclaimer
- This content is based solely on publicly available information.This content is for educational and entertainment purposes only. The author is not a financial advisor, and the content within does not constitute financial advice. All investment strategies and financial decisions involve risk. Readers should conduct their own research or consult a certified financial professional before making any financial decisions.
- The opinions expressed in this article are my own and do not represent the views of Google.

Leave a Reply