How a 1-degree error in your savings rate compounds into a financial canyon — and what it takes to correct your heading
Disclaimer: The opinions expressed in this article are my own and do not represent the views of Google. This content is based solely on publicly available information.This content is for educational and entertainment purposes only. The author is not a financial advisor, and the content within does not constitute financial advice. All investment strategies and financial decisions involve risk. Readers should conduct their own research or consult a certified financial professional before making any financial decisions.
Every commercial pilot is trained on the 1-in-60 Rule: for every 60 miles flown, a heading error of just 1 degree causes the aircraft to drift exactly 1 mile off course. On a short hop from San Francisco to Los Angeles, a 1-degree error is barely worth mentioning. You can eyeball the runway and correct in the final minutes. No harm done.
But financial freedom is not a short hop. It is a 40-year intercontinental flight from age 25 to age 65. And on that timeline, the 1-degree rule stops being a navigational footnote and starts being the most important equation in your personal finances.
The engineers I know — smart, analytically rigorous people who write distributed systems and tune machine learning pipelines — almost universally apply one standard of precision to their code and a completely different standard to their money. They would never deploy a system without monitoring its key inputs. Yet they check their net worth quarterly (a lagging indicator of the past) while ignoring their savings rate (the leading indicator that actually governs the outcome). They are obsessing over the destination while flying blind on the heading.
This article is about the heading.
Why Drift Is Exponential, Not Linear
In aviation, the 1-in-60 rule produces linear drift. Fly for twice as long on the wrong heading, drift twice as far. That is manageable.
In finance, the drift is exponential. This is not a metaphor — it is a direct consequence of compound interest. The future value of a lump sum is:
FV = P × (1 + r)^nwhere P is principal (how much you saved), r is the rate of return, and n is time in years. The critical architectural detail is the position of each variable. P is a linear multiplier — double your savings, double your result. But n lives in the exponent. A small change to n does not add to the result; it multiplies the multiplier.
In software terms: optimizing P is an O(n) improvement. Optimizing n is a complexity class upgrade to O(C^n). One scales your output linearly. The other transforms the shape of the curve.
This means that two investors with identical incomes but a 10-year difference in start date do not end up 25% apart. Based on historical US equity returns of approximately 7% real (the Siegel constant, derived from 200 years of market data), a dollar invested at age 25 experiences four full doubling periods by retirement. The same dollar invested at 35 experiences only three. The difference is not one doubling — it is the most powerful doubling, the final one, when the account balance is largest.
Consider a real simulation from this framework: an early investor puts in $10 per day ($3,650/year) from age 25 to 35, then contributes nothing for the next 30 years. Total capital deployed: $36,500. A late investor starts at 35 and contributes $10 per day every single year through age 65. Total capital deployed: $109,500. Three times the investment, three times the effort, three times the discipline.
At age 65, the early investor finishes with approximately $383,886. The late investor, who worked three times harder and contributed three times more money, finishes with approximately $344,780.
The late investor lost. Not because they lacked discipline. Not because they picked the wrong stocks. They lost because they flew 10 years with the wrong heading, and no amount of later effort could recover the exponential loss in those first doubling periods.
The Invisible Gap That Becomes a Canyon
Here is what makes this problem particularly insidious for high earners: the divergence is invisible for a long time.
In the early years — years 0 through 5 — the difference between someone saving 5% of their income and someone saving 15% is essentially undetectable. They drive similar cars. They live in similar apartments. Their net worth figures look comparable, and market volatility drowns out any signal from the savings rate difference.
This is the 1-in-60 rule in financial form. At 60 miles, 1 degree of error means 1 mile of drift — barely noticeable on a continent-spanning map. But at 600 miles, you are 10 miles off. At 2,400 miles, you have missed your destination by 40 miles. The gap compounds the same way the portfolio does.
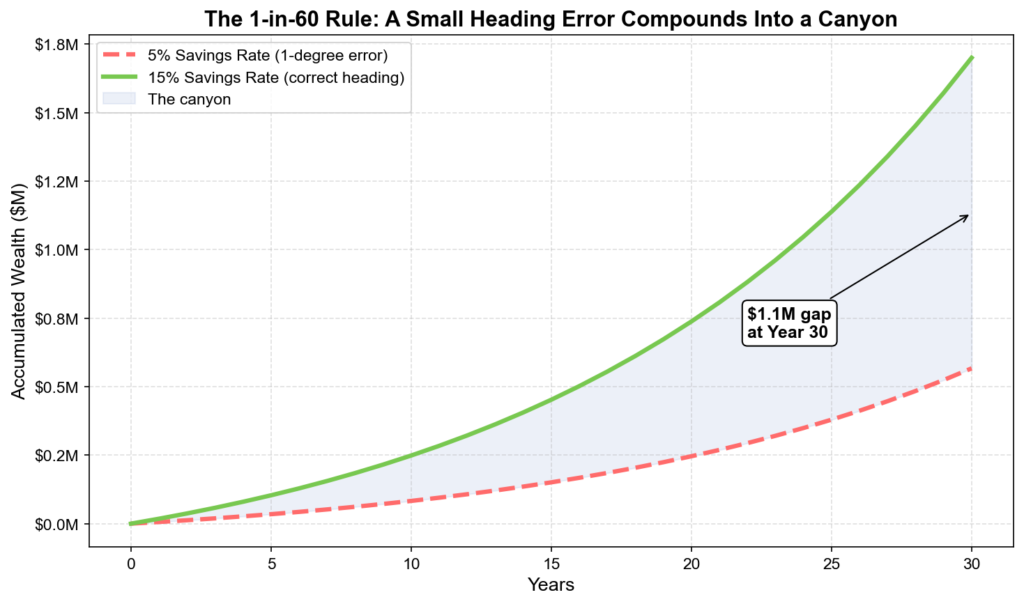
By year 30, what looked like a trivial difference — 5% savings rate versus 15% — produces a result that is not 3× better but closer to 8–10× better, because the higher savings rate had more capital deployed during more doubling periods. Two 55-year-old engineers with 30-year careers and identical salaries can legitimately be in different financial universes purely because of their heading.
This is not theory. This is the observed outcome for the two 50-year-olds you know — one sitting on a $2M portfolio, one anxious about the next layoff. They did not have different talent. They did not have different markets. They had a 1-degree difference in savings rate, compounded over a 30-year flight.
The Double Drift Correction (And Why “Just Save More” Is Wrong)
Now suppose you are a 35-year-old engineer who has finally internalized this. The natural impulse is: “I’ll just adopt the standard 15% savings rate going forward.”
This is the wrong calculation, and aviation tells you exactly why.
In navigation, if an aircraft has been flying 3 degrees off course for two hours, the pilot cannot simply turn 3 degrees back toward the heading. That correction stops the drift but leaves the plane flying parallel to the correct route, permanently offset. To actually intercept the original flight path, the pilot must apply a double drift correction — turning 6 degrees toward the destination to compensate for the accumulated error, then resetting to the original heading once back on track.
The same geometry applies to your savings rate. The standard 15% savings rate was engineered for someone who started at age 25. It assumes four full doubling periods and a clean compound curve from the beginning. If you started at 35, you are not behind by a fixed dollar amount that you can “catch up” on. You are behind on an exponential curve, and the only way to intercept that curve is to overcorrect.
The math requires a savings rate of 30% or more for a late starter who wants to intercept the wealth trajectory of an early starter. Not because 30% is twice as good as 15% in a linear sense, but because you need the overcorrection angle to actually converge with the curve, not merely stop drifting.
“I’ll save more when I earn more” does not fix this. Earning more increases P — the linear multiplier. It cannot restore a lost year of n — the exponent. You cannot buy back time. You can only correct the heading now and fly a steeper angle until you intercept the curve.
Your Savings Rate Is Your Heading
The practical implication of the 1-in-60 rule is a simple dashboard change.
Most engineers track net worth as their primary financial metric. Net worth is a lagging indicator — it reports on the accumulated past. It reflects market volatility, employer equity swings, and real estate fluctuations, most of which are completely outside your control loop. Checking net worth monthly is like monitoring last week’s production error rate and calling it real-time operations.
The leading indicator — the metric that actually determines where the curve goes — is savings rate. Specifically:
Savings Rate = (Income − Expenses) / IncomeThis metric is high-frequency (you can compute it and adjust it monthly), fully within your control (unlike market returns), and causally upstream of every wealth outcome you care about. The freedom timeline formula has exactly one controllable input: savings rate. Income cancels out mathematically. Market returns are external. Everything else is downstream of this single number.
A pilot does not stare at the destination on the map. A pilot watches the heading indicator and makes micro-corrections continuously. Your savings rate is that indicator. If it is consistently at 20%, the destination (financial freedom) is a mathematical output — an inevitability, not a hope.
Correcting Your Heading Starting Now
If you take one thing from this: your financial system is already in flight. The question is not whether you will compound — everything compounds, including debt, lifestyle inflation, and delayed decisions. The question is in which direction.
A 1-degree error feels inconsequential today. It always does. That is the trap. By the time the drift is visible, you are already tens of miles off course and the double drift correction becomes expensive and psychologically painful.
The engineers I most respect in my career were not the ones who wrote the most complex systems. They were the ones who thought hardest about the direction the system was pointed before writing a single line of code. Speed, they understood, is only useful if you are running the right way.
Set your heading now. Run the savings rate calculation. If you are a late starter, apply the double drift — overcorrect until you have intercepted the curve. Then automate that heading so it does not depend on monthly willpower.
The math, once you are on the right vector, handles everything else.
This article is adapted from Chapter 1 of The Wealth Kernel, which builds the full engineering framework for financial independence: the control-theory model for savings, the automation pipeline for capital allocation, and the monitoring dashboard for staying on vector. The 1-in-60 rule is the first principle. Chapter 9 covers how to make it self-executing.*

Leave a Reply