Disclaimer: The opinions expressed in this article are my own and do not represent the views of Google. This content is based solely on publicly available information.This content is for educational and entertainment purposes only. The author is not a financial advisor, and the content within does not constitute financial advice. All investment strategies and financial decisions involve risk. Readers should conduct their own research or consult a certified financial professional before making any financial decisions.
The whole idea behind modern portfolio theory is that markets in different parts of the world are supposed to do their own thing, so if the US hits a rough patch, maybe Europe or Asia will keep chugging along and help balance things out. The hope is that by mixing together investments that don’t always move in lockstep, you can smooth out the bumps and make your overall portfolio less jumpy.
But all of this starts to unravel when people everywhere start reacting the same way, especially when fear or panic takes over in the big global markets.
When you look beyond just two types of investments in the US and start adding in things like international stocks and gold, you can really see where the old idea of global diversification starts to show its cracks. By digging into more than two decades of daily prices for big US stocks, international stocks, emerging markets, and gold, you can actually see where having investments spread around the world helps, and where it just ends up being a complicated and costly way to follow the same ups and downs as the S&P 500.
Running the numbers with a custom analysis tool on these four types of investments really challenges the old-school idea of what makes a portfolio ‘optimal.’ The data shows that the perfect mix of global investments only looks obvious after the fact, and that the supposed safety of international diversification tends to disappear right when you need it most. Even gold, which gets a lot of hype as a kind of financial security blanket, turns out to be just another tool for keeping your portfolio steady.
The Lost Decade re-examined
If we want to see why spreading your investments around the world can matter so much, it helps to look at the toughest stretch for US stocks in recent memory. From the very start of 2000 through the end of 2009, the S&P 500 went through what people now call the ‘Lost Decade.’
After the dot-com bubble burst, US stocks basically went nowhere for a full ten years. If you just bought and held big American companies during that time, you actually ended up with less money at the end of the decade than you started with. It was as if the usual growth machine behind the US economy just stopped working for a while.
Living through ten years where your investments just sit still is incredibly tough for almost anyone. When you see the main stock indexes losing money year after year, it can really shake your confidence in your whole financial plan. Most of us count on steady growth to make our retirement math work, so when that growth disappears for such a long stretch, it’s easy to feel desperate and start taking risks that might not actually help.
But while US tech stocks were working through the fallout from the bubble, something very different was happening overseas. As China grew quickly and needed more raw materials, global commodities took off, and international and emerging markets had a great run. This meant there was a huge difference in how different parts of the world performed during those years.
If you happened to own something like the Vanguard Emerging Markets Index during those same ten years, your portfolio barely noticed the trouble in the US. Emerging markets kept growing at a strong pace, and even developed markets in Europe did much better than the struggling S&P 500. Having a mix of global investments helped protect you from the stress of watching US stocks go nowhere, because your money was working for you in other parts of the world that were just getting started on their own growth stories.
Because of this, a lot of experts started saying that you had to always keep a big chunk of your portfolio in international and emerging markets if you wanted to invest for the long haul. But as it turned out, the next decade told a very different story.
The explicit cost of emerging markets
The basic idea behind putting money into developing countries is that you should get paid extra for taking on more risk. If you move your investment from a big, stable American company to a country where the rules are less clear and things can get pretty unpredictable, you expect to earn more to make up for all the extra headaches—like wild swings in currency value, trouble getting your money out, or even the risk that the government might step in and take over. In theory, investors in these markets are supposed to get a bigger reward because they’re taking on all that extra uncertainty.
But when we actually run the numbers using the last twenty-six years of real market data, that whole idea starts to fall apart. The theory says that if you take on more ups and downs, you should end up with bigger returns in the end. What we see in the data, though, is just the opposite.
The Vanguard Emerging Markets Index was way more volatile than the S&P 500, no matter how you slice the time periods. Investors in emerging markets had to stomach some pretty scary drops—sometimes losing forty or fifty percent of their investment during things like banking crises or big swings in commodity prices.
But even after all those ups and downs over the full twenty-six years from 2000 to 2026, emerging markets just didn’t deliver the extra returns you’d expect for taking on that much risk. In fact, when you look at the final results, the growth rate for emerging markets didn’t actually beat what you would have gotten by just sticking with big American companies.
So you ended up taking on all the wild swings you’d expect from a high-risk, high-growth investment, but in the end, you only got the kind of returns you could have had from a plain old U.S. index fund. That extra reward for risk just wasn’t there. What this really shows is that just putting your money into unpredictable, less regulated markets doesn’t automatically mean you’ll get a bigger payoff. Unless there’s a huge wave of local growth—like what happened from 2000 to 2010—emerging markets can actually drag down the overall performance of your portfolio.
The convergence of global equities
When we talk about international diversification, what we really want is for our investments in different countries to move independently from each other, which is just a fancy way of saying that if American stocks take a dive, we hope our international stocks will hold their ground or even move in the opposite direction. The technical term for this is the correlation coefficient, and in an ideal world, we’d want that number to be close to zero or even negative between the main pieces of our portfolio, so that one can help balance out the other when things get rough.
To see how this plays out in real life, I ran a Python script that looked at how closely Developed International stocks, Emerging Markets, and Gold have moved compared to the S&P 500, using a rolling 10-year window to get a sense of the long-term patterns.
The chart below shows how those relationships have changed over the past twenty years, with the blue line following developed markets and the orange line following emerging markets, so you can see just how much these connections can shift over time.
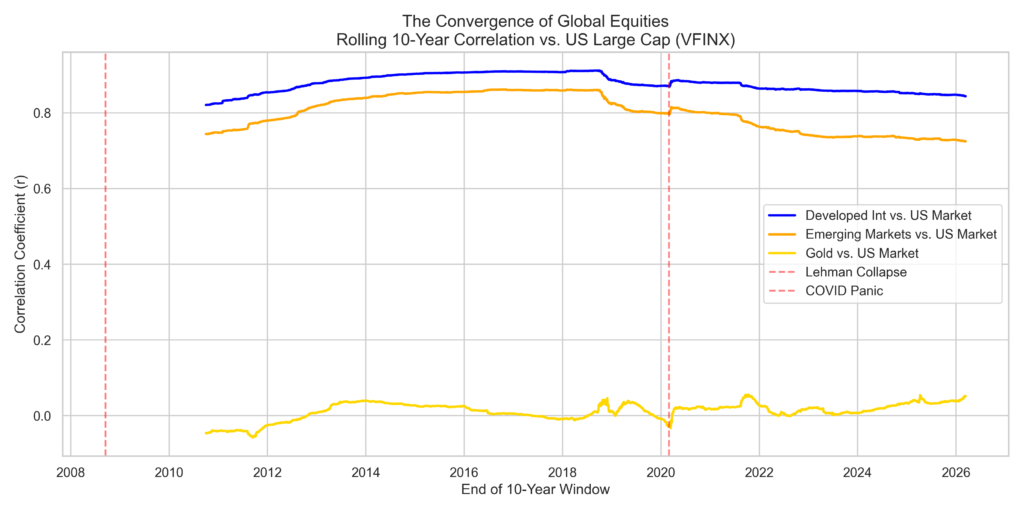
If you look at the way the blue and orange lines move together, it tells a pretty sobering story for anyone trying to spread their investments around the world. Over the last twenty years, the American stock market and the rest of the world’s major stock markets have started moving almost in lockstep, so much so that if you own a European or Asian index fund, it’s likely to behave almost exactly like the American market, with a correlation of 0.85 or even higher.
What’s even more striking is how these supposed boundaries between markets just fall apart when things get really rough. In moments like the COVID-19 panic in 2020 or the chaos after Lehman Brothers collapsed in 2008, every major stock market around the world started moving together, almost perfectly in sync.
So, when fear really takes over the global financial system, all those different stock markets you thought were separate just start moving as one. The moment you need international diversification the most—like when the American market is crashing—it just disappears. Once the Federal Reserve and other central banks start acting in sync, you’re not really investing in separate countries anymore; you’re basically buying into one big, connected market that’s mostly driven by what happens in the US.
The golden parachute
If global stocks let us down right when we need something steady the most, we have to look for another way to cushion the blow. In the chart above, that yellow line near the bottom shows us how gold has actually moved in price over time.
People in finance love to argue about what gold is really worth, trying to tie its price to things like inflation, interest rates, or world events. But if we’re just building a portfolio and looking at the numbers, it doesn’t really matter what gold’s true value is. What matters is what we can actually see in the chart: over the last twenty-six years, even through some major stock market crashes, gold’s connection to the S&P 500 has basically stayed at zero.
This zero-correlation really starts to matter when we run the numbers and try to build the best possible portfolio for the past twenty-six years.
When we let the computer try to build the best risk-adjusted portfolio from 2000 to 2026, it didn’t want anything to do with international stocks. The model gave zero percent to both developed and emerging markets, since adding those riskier international stocks—which tended to fall right alongside the US market—actually made the whole portfolio perform worse.
Instead, the model ended up with a mix of about 38% US large cap stocks and a surprisingly big 62% chunk in gold. The reason for this lopsided split isn’t that gold is a better long-term investment than international stocks, but because gold tends to move in the opposite direction right when US stocks are having their worst moments. In those tough years like 2000, 2008, and 2022, gold acted as the shock absorber that helped the portfolio hold together.
The shifting target of optimization
It’s pretty interesting to see that, if you look back over the last twenty-six years, a mix of 38% S&P 500 and 62% Gold would have given you the best possible Sharpe Ratio. But just because that combination worked out perfectly in the past doesn’t mean it’s a good idea to bet your future on it, since the world is always changing and what worked before might not work again.
The thing about optimization algorithms is that they can’t actually see the future—they just look for patterns in the past, and sometimes they end up fitting themselves a little too closely to what already happened. For example, if you run the numbers on a period when China was ramping up its industrial growth, the algorithm will tell you to load up on emerging markets, because that’s what worked then. Later on, when tech stocks were booming and central banks were keeping rates low, the algorithm shifts its advice to favor the S&P 500. It’s really just reacting to whatever happened to work best in each slice of history, without any sense of what’s coming next.
To really see how shaky these historical optimization models can be, I decided to break up the twenty-six years of data and look at it in smaller chunks. Instead of just running one big calculation for the whole period, I set up a Python script to check, month by month, what the ‘perfect’ portfolio would have looked like if you only had the previous five years of data to go on. This way, we could watch how the so-called ideal mix of investments kept changing as the world changed around it.
When you look at the stacked area chart that comes out of this, you can really see just how much the ‘perfect’ portfolio keeps shifting and mutating over time.
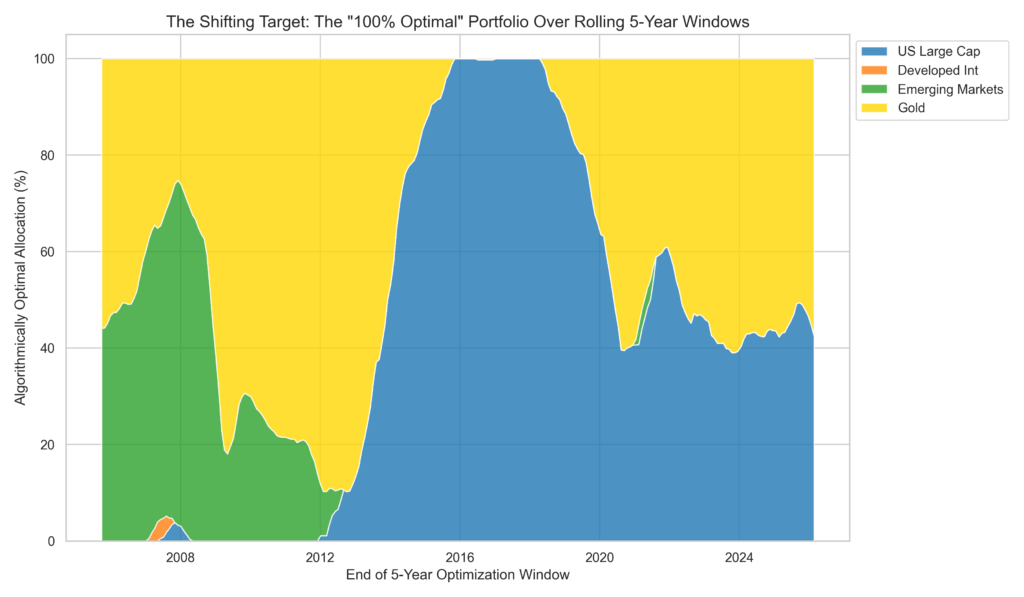
When you look at the visualization, it really breaks the idea that there is some perfect, easily calculated portfolio just waiting to be found. Instead of being a fixed answer you can solve for, the best mix of assets is more like a moving target that keeps changing as the world changes, and it never quite sits still long enough for you to pin it down.
Right after the 2008 crisis, if you let the algorithm look back at what just happened, it would have told you to put almost everything into gold, since that would have looked best on paper for managing risk. But if you actually did that and moved all your money into gold at that moment, you would have missed out on the huge run-up in American tech stocks that started in 2010, and your long-term growth would have taken a real hit.
Then by 2020, when the S&P 500 was leading the world in returns, that same algorithm suddenly flipped and told you to put everything into American stocks, ignoring every other region completely.
The explicit danger of regime shifts
If there’s one thing that really jumps out when you look at how to optimize your investments by geography, it’s that trying to chase the mathematically perfect mix is almost a sure way to set yourself up for trouble. The moment you build your whole portfolio around what worked best in the last specific situation, you’re basically preparing for a world that already passed you by.
When the big picture in the economy suddenly changes—like if we swing from years of falling prices to a world where supply chains drive costs up, or if America’s tech boom gives way to a comeback in old-school manufacturing somewhere else—the portfolio that was built for the last decade just doesn’t hold up anymore.
Since what works best in different parts of the world can change so quickly, owning a global index that weights everything by size is probably the best way to protect yourself from surprises. Instead of trying to guess which country or region will win the next big cycle, you just let the market do the heavy lifting for you. This way, your money naturally follows whatever area is doing well, and you avoid the risk of going all-in on the wrong place at the wrong time.
A global stock index takes the guesswork and emotion out of deciding where to invest. If American tech companies are on a roll, the index naturally gives you more exposure to them. If things shift and European factories start leading the way, your portfolio quietly adjusts without you having to make any big moves yourself.
In a way, you’re letting go and trusting the process. The numbers show that it’s impossible to build the perfect portfolio for the future, so by sticking with a global, cap-weighted approach, you accept that you’ll never have the absolute best mix at any one moment—but you also avoid ever having the worst. Over the long run, this steady, middle-of-the-road strategy gives you the best shot at making it through whatever the world throws at you.
References
[1] Asness, C., Frazzini, A., & Pedersen, L. H. (2012). Leverage Aversion and Portfolio Choice. Journal of Political Economy.
[2] Fama, E. F., & French, K. R. (2012). Size, Value, and Momentum in International Stock Returns. Journal of Financial Economics.
[3] Roll, R. (1992). Industrial Structure and the Comparative Behavior of International Stock Market Indices. The Journal of Finance.
[4] yfinance Documentation and API data. (2026). Aggregate historical closing prices for Vanguard VFINX, VGTSX, VEIEX, and Gold GC=F across 2000 through 2026.

Leave a Reply