
Disclaimer: The opinions expressed in this article are my own and do not represent the views of Google. This content is based solely on publicly available information.This content is for educational and entertainment purposes only. The author is not a financial advisor, and the content within does not constitute financial advice. All investment strategies and financial decisions involve risk. Readers should conduct their own research or consult a certified financial professional before making any financial decisions.
It’s easy to think that passive index funds simply buy up the market according to which companies are the biggest, because on the surface, it feels logical that a company pulling in huge revenue and sporting a two-trillion-dollar valuation would naturally take up the most space in global equity indices. But here’s the twist: that’s not actually how it works. Instead of tracking the sheer size of a company, these indices are really following the size of what’s available for people to trade—the company’s liquidity.
The reason for this difference comes down to something called float adjustment, which is just a fancy way of saying that not all shares are actually up for grabs. The big numbers you see on financial news—the total market capitalizations—can be pretty misleading, especially for companies where a lot of the shares are held tightly by founders, governments, or big parent companies. If those major players decide to hang onto their shares and not sell, then for everyone else in the market, it’s almost as if those shares aren’t even there.
Index providers like MSCI and S&P are well aware of this issue, because if a huge index fund tried to buy its ‘fair share’ of a company where only a tiny slice of the stock actually trades, it would end up pushing the price all over the place, which is the opposite of what passive investing is supposed to do. So, to keep things running smoothly, these indices actually adjust their calculations by leaving out the shares that are locked away and not available to the public. In the end, what you really own through an index fund isn’t the whole market, but just the part that’s actually floating around for people to buy and sell.
The illusion of the headline number
Total market capitalization is pretty straightforward: you just take the current share price and multiply it by all the shares the company has ever put out there, but this is really just a theoretical number, since it assumes that every single share could actually be sold at today’s price, which we know isn’t really possible in practice.
Float-adjusted market capitalization tries to get closer to reality by only counting the shares that people can actually buy and sell on the open market, leaving out things like restricted stock, government stakes, or big blocks held by other companies. For most big American companies, this adjustment barely changes the number—Apple, for example, has almost all its shares available to trade—but for some international giants or companies that have just spun off from a parent, the difference can be huge and really change how much they matter in an index.
To see just how much float adjustment can change the picture of who really matters in an investment fund, let’s imagine a simple index made up of four companies, using some rough numbers from early 2026: Saudi Aramco, which has a lot of shares owned by the government; Arm Holdings, where insiders hold a big chunk; Volkswagen, which is influenced by family and state groups; and Apple, which is our example of a company where almost anyone can own a piece.
Running the math on concentrated ownership
Let’s look at what would happen if an index gave each company a spot based on its total size, compared to how things actually work when only the shares that are available for trading count toward their weight.
First, if we just look at the raw numbers, Saudi Aramco is huge, with a total value of about $1.73 trillion spread across 242 billion shares. But here’s the catch: only about 5.94 billion of those shares are actually available for people to buy and sell, since the rest are held by the government. That means, when you adjust for what’s really out there in the market, Aramco’s size drops all the way down to $42.47 billion. Arm Holdings is in a similar boat, since even though it’s worth $122.9 billion on paper, only a much smaller chunk—$15.89 billion—can actually be traded, because SoftBank holds onto most of the shares.
| Company | Total Market Cap ($B) | Float-Adjusted Cap ($B) | Float % | Theoretical Weight (Total Cap) % | Actual Weight (Float Cap) % |
|---|---|---|---|---|---|
| Saudi Aramco | 1730.30 | 42.47 | 2.45 | 36.75 | 1.47 |
| Arm Holdings | 122.96 | 15.89 | 12.92 | 2.61 | 0.55 |
| Apple Inc. | 2802.80 | 2799.16 | 99.87 | 59.53 | 96.97 |
| Volkswagen AG | 52.12 | 29.19 | 56.00 | 1.11 | 1.01 |
If you look at the table above, you can see how the penalty actually works in practice, since Saudi Aramco only has about 2.45% of its shares available for trading, which means that, from the point of view of someone building an index, almost the entire company is basically invisible. Apple, on the other hand, has nearly all of its shares out there in the market—about 99.87%—so it doesn’t get penalized at all.
Visualizing the tradability gap
If we take a closer look at how much of a company’s equity is actually available to trade versus how much is locked away, we start to see what those passive index strategies are really leaving out, and the chart below helps break down these different slices of equity so we can see the whole picture.
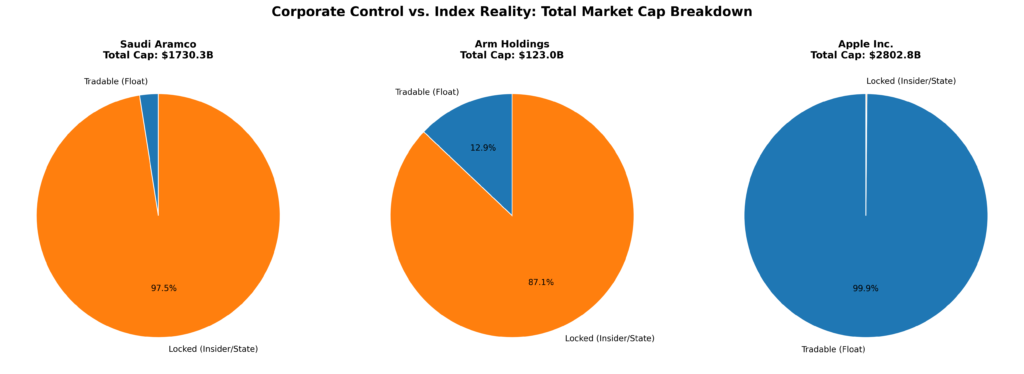
What these charts really show is that, when you look at the numbers, the market is only touching a small piece of the real economic value out there. For example, the blue part of the Saudi Aramco chart is where all the trading action happens, while the orange part is equity that just sits there and doesn’t move at all.
The distortion of index influence
One thing that often gets overlooked with float adjustment is how it quietly gives an extra boost to companies where the shares are already spread out among lots of different owners, because when an index takes a little bit away from a company whose shares are locked up, that small slice of the pie has to get handed off to someone else, and it usually ends up with the companies that are already widely owned.
To see how this plays out, we ran the numbers on a simple example with four stocks, just to get a sense of how much money actually moves around when these adjustments happen, and it turns out that if the indices just used the total market value instead, the way the money gets split up would look pretty different.
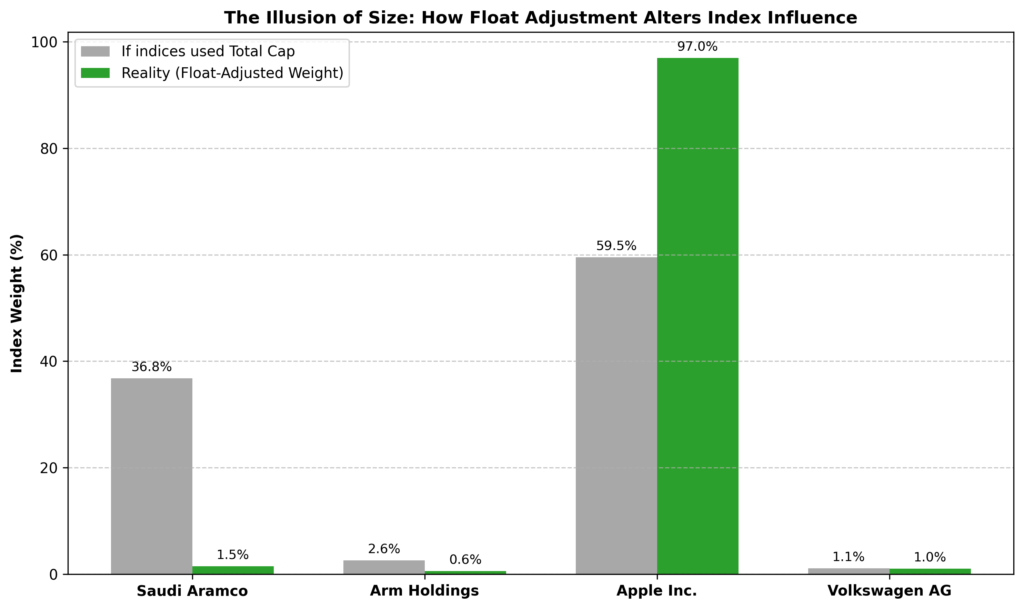
If you check out the bars for Apple, you’ll notice that in a world where we just go by total market cap, Apple would make up about 59.5% of this little four-stock portfolio, which already feels pretty big. But in practice, things work a bit differently, since float adjustment comes into play. Because companies like Aramco and Arm have so many shares locked up with insiders, they get knocked down in the rankings, and all that extra weight has to go somewhere, so Apple ends up soaking up almost 97% of the portfolio, which is kind of wild when you think about it.
The reason these big tech companies end up with such a huge slice of the pie isn’t really because they’re making more stuff or employing more people than everyone else; it’s mostly because their shares are out there in the open, with hardly any locked away by insiders. The way the index works, it doesn’t care about how much money a company brings in or how many people it hires—it just looks for shares that are easy to buy and sell.
The final verdict on passive weighting
What’s funny is that the whole passive investing system just skips over anything it can’t actually buy, so all those trillions flowing into global ETFs are really just following a rule about what’s available to trade, not what’s actually worth the most or doing the most in the real world.
So does this focus on float create some hidden risks? It probably does, since all this global money keeps getting funneled into the same handful of companies, not because they’re necessarily better, but just because their shares are easy to buy and sell. As long as big shareholders or governments keep holding onto their locked-up shares, the official market cap for those companies is really just a number on paper. Once you see how the float adjustment works, you can start to see exactly where your passive investments are actually ending up.
References
[1] S&P Dow Jones Indices Float Adjustment Methodology
[2] Saudi Aramco 2026 Shareholding Structure Data Approximations
[3] Arm Holdings Institutional Ownership and Float Disclosures
[4] Apple Inc. Outstanding Shares Data
[4] Volkswagen AG Preferred vs Common Share Outstanding Equity Data

Leave a Reply