
Disclaimer: The opinions expressed in this article are my own and do not represent the views of Google. This content is based solely on publicly available information.This content is for educational and entertainment purposes only. The author is not a financial advisor, and the content within does not constitute financial advice. All investment strategies and financial decisions involve risk. Readers should conduct their own research or consult a certified financial professional before making any financial decisions.
Every December, there’s this idea that keeps coming up on Wall Street: maybe you can scoop up the stocks that have had a rough year, just before New Year’s, and then turn around and sell them for a quick gain once January rolls around. This is what people call the January Effect, and the logic behind it is pretty straightforward. Investors tend to sell off their losing stocks in December to lock in tax losses, which pushes down the prices of smaller companies, and then, when the calendar flips to January, that selling pressure suddenly disappears. The hope is that new money—maybe from bonuses or just a fresh start—flows in and gives those stocks a quick boost.
Back in the 20th century, this wasn’t just a theory—it was about as close as you could get to a free lunch in the stock market, and all you really needed was a calendar. These days, though, things have changed. We’re in a world where high-speed trading algorithms can spot and erase any little edge in a blink, where ETFs are constantly working to squeeze out every last bit of extra return, and where even regular folks have access to more information than most hedge funds did a generation ago. In a market like this, any pattern that becomes well-known usually gets traded away so quickly that it barely has a chance to show up in the data.
So as another year comes around, the real question isn’t whether the January Effect used to work, but whether it still has any life left in today’s fast-moving markets. Has the edge disappeared, or just changed shape? To figure this out, we can’t just go by old rules of thumb—we need to look at the market like a noisy system, where some patterns are real and others are just random. That means digging into the data, trying to separate out the effects of things like tax-driven selling, changes in liquidity, and swings in volatility from all the day-to-day noise. In this analysis, I’m looking at the last 30 years of market history, comparing how small-cap stocks (using the Russell 2000) stack up against large caps (the S&P 500). Along the way, I’ll check out whether traders are jumping the gun on the January Effect, how interest rates might be changing the game, and whether this old pattern is still worth paying attention to in 2025—or if it’s just a story we keep telling ourselves.
The Decay of the Signal
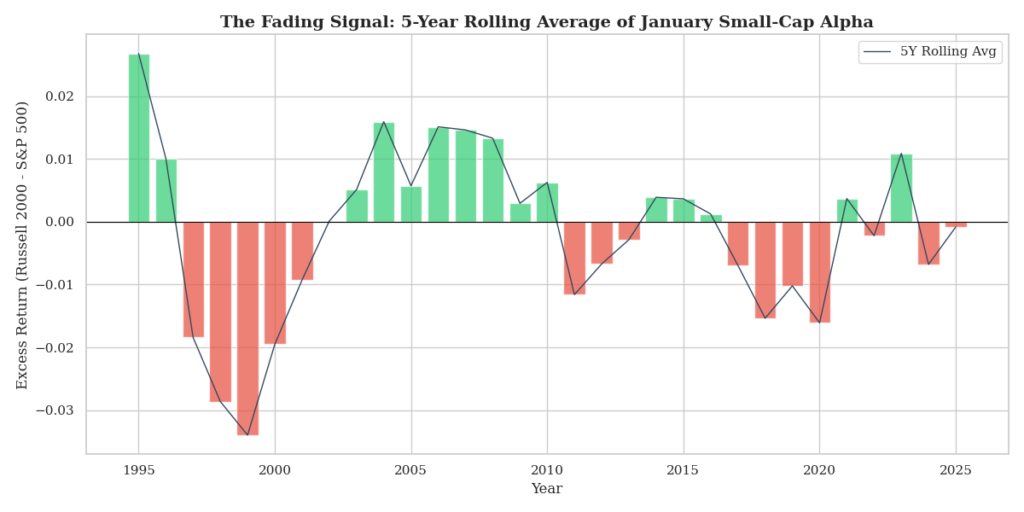
If we want to understand what’s going on with the January Effect these days, it makes sense to first look back at how it used to show up in the numbers. For this, I’m using something I’ll call January Alpha, which is just a way of measuring how much better small-cap stocks (think the Russell 2000) do compared to big companies (like those in the S&P 500) during January. Figure below shows January Alpha in 5 years rolling average. When this number is above zero, it means small caps are having a good January; when it’s below zero, the bigger companies are coming out ahead. Looking at the data from 1990 to now, it’s pretty clear that the difference between a real signal and just random noise has mostly disappeared.
Back in the 1990s and early 2000s, putting your money on small-cap stocks in January felt like a pretty safe bet, mostly because you could count on people selling off these stocks in December, and since there weren’t as many buyers or sellers in the small-cap world, prices could jump quickly when demand came back in January. That’s why, during the 2000s, small caps outperformed by almost a full percent in just that one month. But as we move into the 2010s and 2020s, that clear pattern just isn’t there anymore. Here are the summaries per decade:
- 1990s Decadal Average Alpha: ~0.02%
- 2000s Decadal Average Alpha: +0.94%
- 2010s Decadal Average Alpha: -0.31%
- 2020s Decadal Average Alpha: -0.58%
So, the pattern is hard to miss: not only has the January Effect faded away, but over the last decade, it’s actually turned upside down, with small caps now falling behind large caps in January, year after year. If you check out the rolling averages, it really looks like this old pattern is just about finished.
So what actually changed here? As more folks started catching on to the January Effect, everyone tried to jump in a little earlier, which meant prices got pushed up ahead of time and the edge kind of faded away. Plus, the way people trade small-cap stocks has changed a lot, because things like ETFs and computer-driven trading have made it much easier to get in and out quickly, so those big swings we used to see when everyone rushed back into small caps just don’t really happen anymore. If you look at the numbers, small caps have only beaten large caps in January about 42% of the time since 1990, which is actually worse than just flipping a coin, so that old rule of thumb doesn’t really work these days.
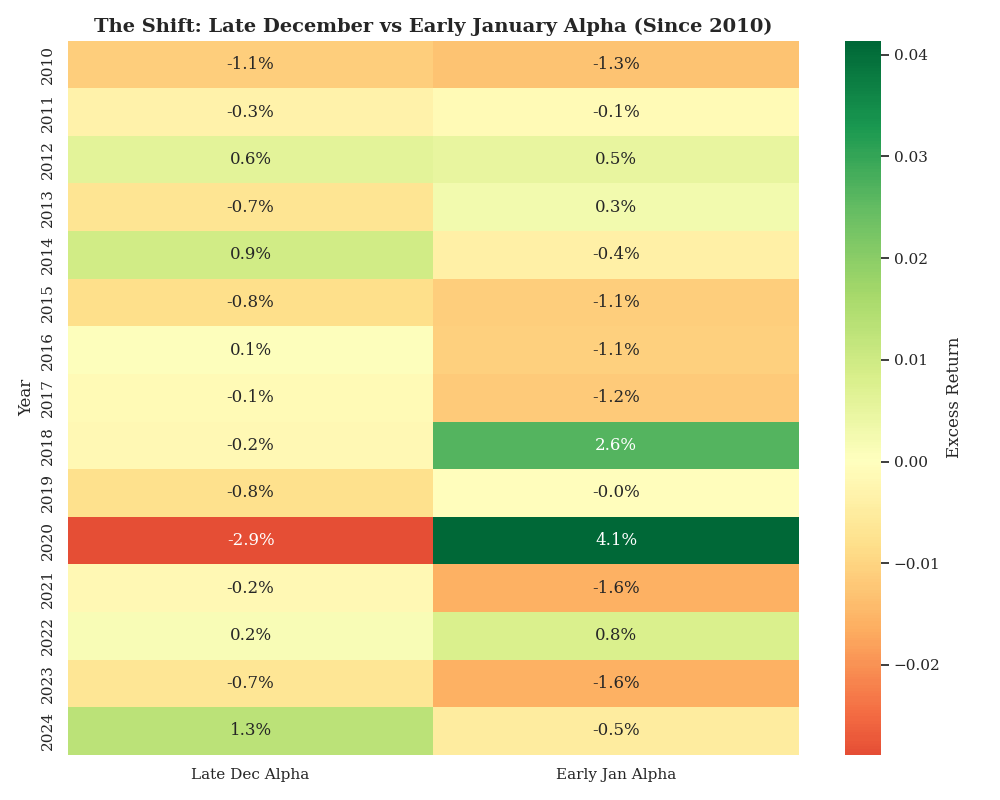
One of the main arguments people make against the idea that the January Effect is dead is something called the ‘Front-Running Hypothesis.’ The basic idea is that the smart money, expecting a bounce in January, actually starts buying in late December instead, so any advantage should show up during what’s known as the ‘Santa Claus Rally’—those last five trading days of the year. If this theory is right, we’d expect to see small-cap stocks get a boost in late December, as investors try to scoop up bargains left behind by tax-loss sellers. To check this, we looked at how the Russell 2000 did compared to the S&P 500 during two windows: the last five days of December and the first five days of January.
When you look at the numbers since 2015 (in figure below), the front-running idea really doesn’t hold up. On average, small caps actually lost about 0.4% in the last five days of December, and barely budged in the first five days of January. So, there just isn’t much buying happening. Small caps are still getting sold off at the end of the year, which means tax-loss selling is still a thing, but the bounce we used to see in January has basically disappeared. Instead of new money jumping in to grab those small-cap bargains, it seems like investors are either steering clear or putting their cash into bigger, safer companies. So, the old strategy of buying the dip in small caps just isn’t paying off anymore.
To see why this edge has faded, it helps to look at how the market itself has changed over time.
In 1995, if you wanted exposure to small caps, you bought individual stocks or mutual funds, meaning that when tax-loss selling hit Ticker A, it created an idiosyncratic price distortion specific to that asset. Today, however, liquidity is pooled via ETFs like IWM (iShares Russell 2000), allowing investors to swap one ETF for another (e.g., selling IWM and buying VBR) to realize losses while maintaining delta exposure—a “wash sale” avoidance strategy that prevents the price dislocation that historically created the opportunity.
Small-cap companies are just built differently from the big tech names everyone talks about. Many of them don’t make steady profits and have to borrow money at rates that can change quickly. Since interest rates jumped after 2022, these companies have had a much harder time, and that pressure is a lot stronger than any seasonal pattern. When borrowing costs are high, small companies are just trying to keep their heads above water, not rallying just because it’s January. The data shows that higher interest rates keep weighing down small-cap returns, so the old January bounce gets drowned out. And since the January Effect is now one of the most talked-about patterns in finance, it’s lost its edge—once everyone knows about a trick, it stops working. Lately, the popular move has been to use any January strength as a chance to get out, not to buy in and hold.
The Structural Mismatch
If we want to get to the bottom of why the Russell 2000 behaves so differently from the S&P 500, it really helps to peek under the hood and see what kinds of companies actually make up each index, since just calling something ‘small cap’ doesn’t really capture the whole picture. The S&P 500 these days is loaded with giant tech companies, software businesses, and service firms that tend to have strong balance sheets and plenty of cash, which is why people think of them as high quality. Meanwhile, the Russell 2000 is more like a collection of smaller, often local businesses—think regional banks, biotech companies that are still trying to find their footing, and manufacturers—that feel every bump in the road when it comes to things like interest rates. When borrowing costs go up or the yield curve gets weird, these companies can really struggle to make ends meet, and since a lot of them aren’t even profitable yet, they have to keep borrowing just to keep the lights on. Back when interest rates were close to zero, that wasn’t such a big problem, but now that rates are higher, it’s a much tougher environment for them.
This difference in what kinds of companies fill each index goes a long way toward explaining why the January Effect just doesn’t play out like it used to, because the money that shows up at the start of the year isn’t simply following the calendar anymore—it’s searching for quality, which usually means it flows into the big, profitable companies instead of spreading out evenly. Instead of lifting all stocks together, most of the new money ends up chasing the ones that are already strong, while the smaller, more debt-heavy companies get left behind. It used to be that a rising tide would lift all boats, but these days, it feels more like only the sturdiest ships are getting carried along, while the rest are left bobbing in place.
It’s also worth rethinking the psychology behind all of this, because the old theory depended on the idea that tax-loss selling in December would overpower our natural tendency to hang onto losing stocks just to avoid admitting defeat. Normally, people want to sell their winners too soon and hold onto their losers for too long, but tax-loss harvesting is supposed to be the rational move that flips that script—selling the losers at the end of the year to balance out the gains. For the January Effect to really work, you’d need a big wave of this kind of selling in December to push prices down, setting the stage for a bounce in January. But what happens if that wave isn’t happening all at once anymore? With things like direct indexing and robo-advisors, tax-loss selling can happen any time a stock drops below what someone paid for it, not just in December. So instead of a big rush to sell at the end of the year, the selling gets spread out over time, and the old seasonal pattern just kind of fades away because technology has smoothed it out.
Where the Alpha Hides
So, should we just toss out the whole idea of the January Effect? I don’t think it’s that simple, because even though it’s tough to count on making money from it in any given year, there’s something that caught my eye when I dug a little deeper. What I found is that how small caps do in January seems to be tied pretty closely to how the market did the year before, and the pattern is actually pretty clear as it shown in below figure. If the S&P 500 had a strong year and went up more than 10%, small caps in January tend to lag a bit, with an average Alpha of -0.42%. But if the previous year was rough and the S&P 500 finished in the red, small caps actually do a little better in January, with an average Alpha of +0.14%. And if the market was just kind of muddling along, not really up or down by much (somewhere between 0% and +10%), then small caps really shine in January, with an average Alpha jumping up to +0.80%.
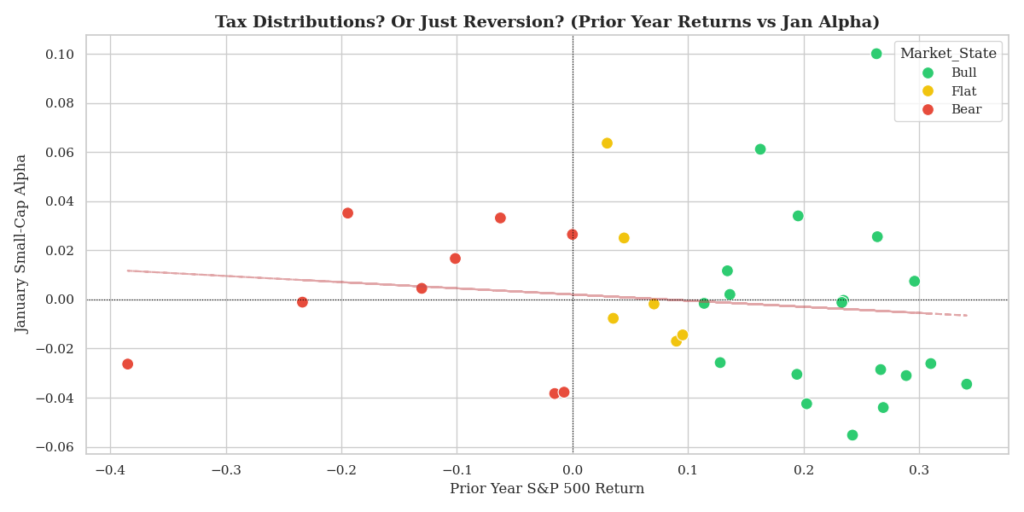
This actually lines up with how things work. In a strong year, like 2024, most people’s portfolios are doing well, so there aren’t many losing stocks to sell in December. Without that wave of tax-loss selling, there’s nothing to set up a bounce in January. So, buying small caps after a big year is like waiting for a machine to turn on when it’s not even plugged in. But after a rough or sideways year, there are lots of losses to harvest, and that leads to heavy selling in December. When that selling stops, the bounce in January can be sharp and real. So, the January Effect isn’t really about the calendar—it’s about how much pain there was in the market the year before. If there aren’t any losses, there’s nothing to bounce back from.
Conclusion
The old idea that you can just buy small caps at the end of December and expect to make money in January doesn’t really hold up anymore. The numbers show that this strategy has lost its edge, with a win rate that’s worse than a coin toss and negative returns over the last decade. But the basic idea behind it—tax-loss selling—still matters. It just doesn’t work all the time. In 2025, the real opportunities aren’t in the simple patterns you read about in textbooks, but in understanding when the right conditions are in place. The January Effect isn’t gone, but it only shows up when the market has taken a beating. If you want to catch it, you have to be patient and wait for those tough years.
References
- Keim, Donald B. “Size-related anomalies and stock return seasonality: Further empirical evidence.” Journal of Financial Economics, 12.1 (1983): 13-32.
- Haug, Mark, and Mark Hirschey. “The January Effect.” Financial Analysts Journal, 62.5 (2006): 78-88.
- Ciccone, Stephen J. “Investor optimism, tax-loss harvesting, and the January effect.” Journal of Applied Business and Economics, 12.2 (2011): 62-70.
- Banz, Rolf W. “The relationship between return and market value of common stocks.” Journal of Financial Economics, 9.1 (1981): 3-18.
- Reinganum, Marc R. “A misspecification of capital asset pricing: Empirical anomalies based on earnings’ yields and market values.” Journal of Financial Economics, 9.1 (1981): 19-46.

Leave a Reply