Disclaimer: The opinions expressed in this article are my own and do not represent the views of Google. This content is based solely on publicly available information.This content is for educational and entertainment purposes only. The author is not a financial advisor, and the content within does not constitute financial advice. All investment strategies and financial decisions involve risk. Readers should conduct their own research or consult a certified financial professional before making any financial decisions.
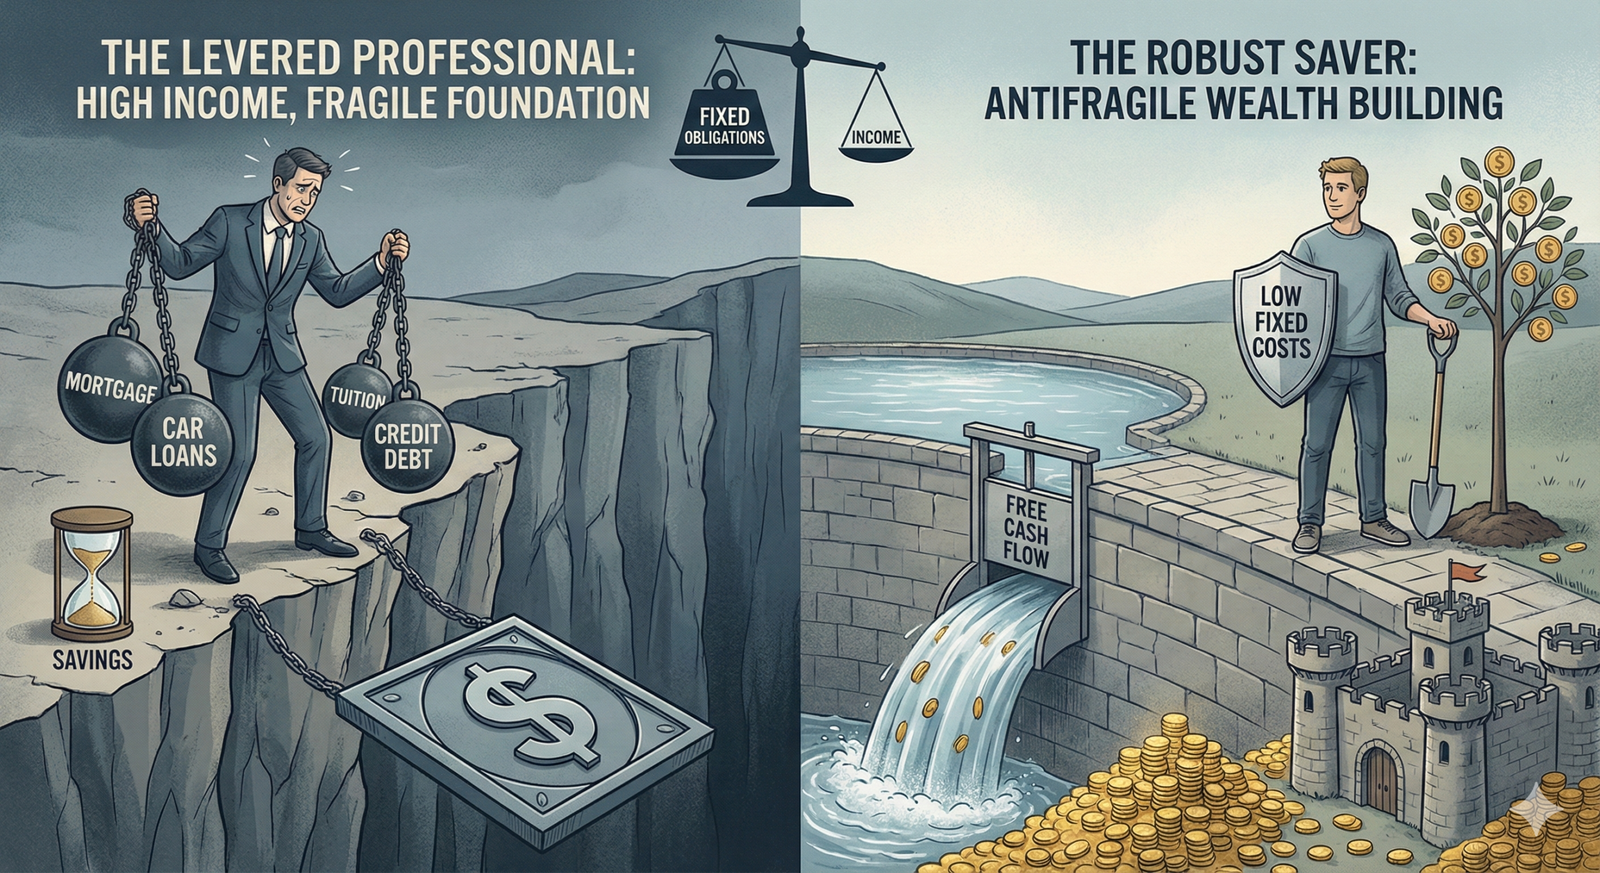
Let’s try to figure out why some households can feel so shaky, even when the paychecks look impressive, by borrowing a simple idea from the world of corporate finance called Operating Leverage. The heart of it is this: when your regular bills are high, you can find yourself in a spot where things can unravel fast if something goes wrong, but it’s tough for things to get much better than just treading water. So, when it comes down to it, what really counts isn’t the size of your salary, but how much money you actually have left after all the bills are paid.
If you look around right now, it’s getting pretty hard to ignore the cracks in the picture of the so-called ‘wealthy professional.’ Bankruptcy filings in the US have jumped by about 16% in 2025, but what really stands out is what’s hidden inside those numbers: more and more high earners are running into trouble. There’s even a name for this group—’HENRYs,’ or High Earners, Not Rich Yet—think of software engineers, doctors, and lawyers making $250,000 a year, but still living paycheck to paycheck and just one small recession away from a real mess. At the same time, someone making $80,000 in a less expensive city might be sleeping soundly, with a year’s worth of savings tucked away in the bank.
So how does this actually happen? How can someone bring in a quarter-million dollars a year and still feel broke? It’s not really about buying too many lattes or just falling into the usual lifestyle inflation trap. The real issue goes a bit deeper, because most of us have set up our financial lives in a way that misses a simple idea from corporate finance called Operating Leverage.
A lot of us end up handling our money a bit like a government office, spending whatever comes in and then just hoping for a bigger budget next year. But the folks who end up in a much stronger spot usually think more like a scrappy startup, always looking for ways to keep their regular bills low so there’s more left over at the end of the month. To see why a big salary isn’t always the safety net it seems to be, let’s try out a simple way to picture your money: the Dollar Army.
The Dollar Army
The way you think about your money really shapes how you use it, so let’s try out a metaphor together. Imagine every dollar you earn as a little soldier in your own personal army, and you’re the General, trying to secure new ground and grow your territory. But for someone with a lot of debt, this Dollar Army is always on a rescue mission. As soon as your paycheck lands, your dollars are already being sent out to rescue hostages from behind enemy lines.
- The Housing Hostage: You send 6,000 soldiers to rescue the Mortgage (or Rent) hostage. If you don’t send them, the bank takes the house.
- The Transport Hostage: You send 2,000 soldiers to rescue the Tesla and the SUV. The enemy (the lender) holds the title.
- The Daycare Hostage: You send 3,000 soldiers to pay for premium childcare.
- The Past War Hostage: You send 2,000 soldiers to pay the minimums on credit cards—fighting battles (paying for dinners and vacations) that happened six months ago.
This image shows this metaphor very accruatly (I used Gemini Nano Banan Pro to create this):
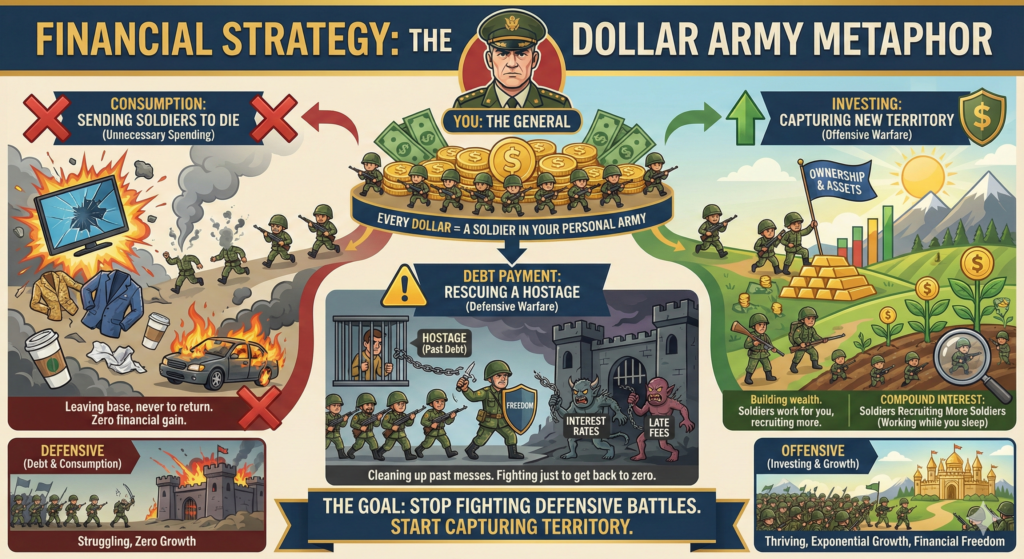
After all these rescue missions, you might start the month with $20,000, but by the time the bills are paid, you’re left with just a handful of dollars, which means there’s not much left to send out to explore new opportunities or make progress, and it can feel like you’re just treading water instead of moving ahead. But if you imagine someone who keeps their regular bills low, their Dollar Army isn’t constantly running around putting out fires; instead, most of their dollars are free to go out and look for new ground to win, so after covering the basics, the rest can be sent to buy a piece of the stock market, invest in a rental property, or maybe even help start a small business. And here’s the part I find really exciting: once you’ve managed to win some new ground, that territory starts sending you its own reinforcements, like dividends, rent, or just growing in value, so your army gets a little bigger each month without you having to do much extra. At the end, what really matters isn’t how big your army is at the beginning, but how many soldiers you can keep and grow over time, because a huge army that loses most of its strength just to survive each month is actually weaker than a smaller, leaner force that keeps getting stronger year after year.
The Macro Context
It’s important to remember that this isn’t just about personal choices. The whole game has changed, and people with high fixed costs aren’t being foolish; they’re just reacting to some big changes in the economy itself. Back in 1970, most of a household’s spending went to things that could be adjusted, like food, clothes, and entertainment, while housing and healthcare were just smaller pieces of the budget. Fast forward to 2026, and it’s a whole different story. The price of ‘stuff’—like TVs, clothes, and electronics—has dropped a lot thanks to globalization and technology, but the cost of ‘security’—things like housing, healthcare, and higher education—has shot up way faster than inflation.
This shift has pushed a lot of middle and upper-middle class families into a life where most of their bills are fixed and can’t easily be changed. If you want your kids to go to good schools, you end up buying into an expensive neighborhood. If you want stable healthcare, you pay higher and higher premiums. We’ve traded a life where most costs could be cut in a pinch for a life where most costs are locked in, and that makes today’s households more fragile than those in 1970, even if the paychecks are bigger.
Defining Personal Operating Leverage
In corporate finance, Operating Leverage measures a company’s ratio of fixed costs to variable costs. Think of two companies:
- United Airlines: Massive Operating Leverage. They have to pay for the planes, the fuel contracts, the pilots, and the gate fees whether the plane is full or empty. If revenue drops 10%, their costs stay the same, and profits might drop 100%. They are fragile.
- WhatsApp (in 2014): Zero Operating Leverage. 50 engineers serving 400 million users. If revenue drops, their costs (servers) drop slightly, but they are not burdened by massive fixed obligations. They are robust.
We commonly measure this with the Degree of Operating Leverage (DOL):
When your operating leverage is high, even a small drop in your income can lead to a big drop in what you actually get to keep. It’s like turning up the volume on risk. We can define Personal Combined Leverage (PCL) similarly. It is the degree to which your lifestyle is locked into fixed, recurring obligations.
Or more dangerously, as a function of safety:
If your fixed costs are $10,000 a month and your income is $11,000, your solvency ratio is just 1.1. That’s kind of like flying a jumbo jet with only 10% fuel in the tank. When your operating leverage is high, your financial life has a ceiling on how good things can get—the best you can do is pay your bills on time—but there’s no floor on how bad things can get if your income drops or stops, and you could run out of money almost right away.
Let’s break down what actually happens to someone earning $250,000 a year. It sounds like a huge number, but once taxes and all the must-pay bills are taken out, it disappears a lot faster than you might think.
- Income:
- Monthly Gross: ~$20,833
- Taxes (Fed, State, FICA): ~$7,500 (Effective ~36%)
- Net Pay: $13,333
- The Fixed Cost Stack:
- Mortgage/Tax/Ins: $5,500 (Nice home, HCOL area)
- Car Payments (x2): $1,400 (SUV + Sedan)
- Student Loans: $1,200 (Law/Med school or MBA)
- Childcare: $2,500 (Full-time for one kid)
- Utilities/Phone/Internet: $600
- Insurance (Life, Disability, Umbrella): $300
- Groceries (Basic): $1,200
So, the total fixed burn is $12,700, while the remaining margin is $633. It only takes a flat tire, a trip to the emergency room, or an unexpected wedding to push them into debt. On paper, they’re in the top 5% of earners, but in real life, they’re living right on the edge.’re living right on the edge. Let’s analyze this more with two simulations:
Simulation 1: The Trap (Risk Profile)
Our brains aren’t great at imagining shocks; we tend to assume next year will look just like this year, maybe with a small raise. Let’s test this with a simulation. We will compare two profiles under a severe stress test: a sudden job loss that lasts 6 months, followed by re-employment at 50% of the previous salary. This is a common scenario during deep recessions or industry pivots (like the recent tech layoffs). Let’s define our cases:
- Profile A: The Levered Professional
- Net Income: $250,000/year (~$20.8k/month).
- Fixed Costs: $180,000/year ($15k/month). This includes the mortgage, two car notes, private school tuition, and insurance.
- Savings: $20,000 (One month of gross income).
- Fixed Cost Ratio: 72%.
- Profile B: The Robust Saver
- Net Income: $150,000/year (~$12.5k/month).
- Fixed Costs: $60,000/year ($5k/month).
- Savings: $40,000.
- Fixed Cost Ratio: 40%.
We simulate a 24-month period in which income drops to zero at Month 1, remains at zero for 6 months, and then returns to 50% of its original level.
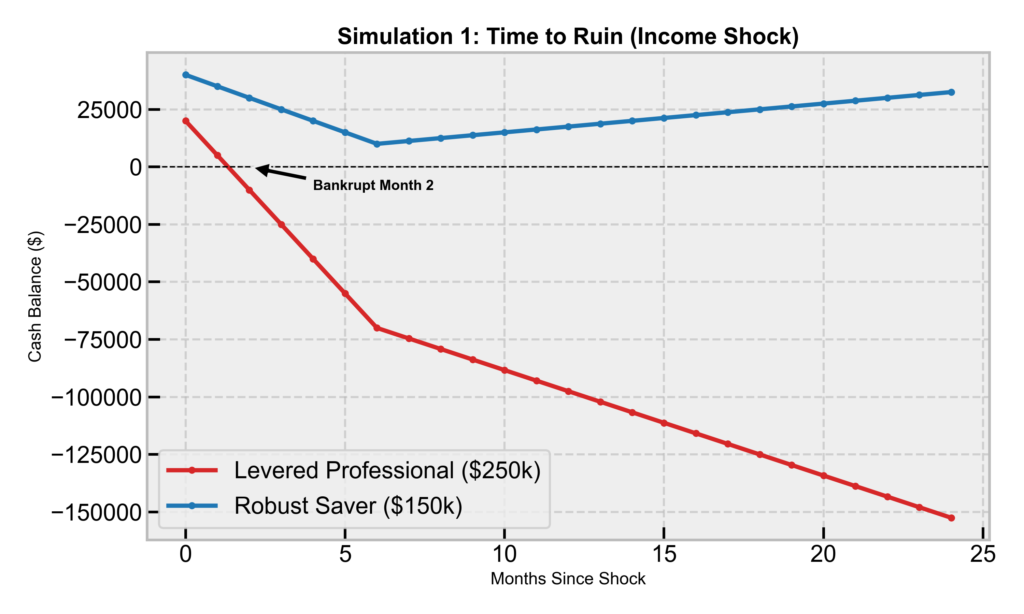
Look at the red line in the chart above. The Levered Professional crashes almost immediately; within Month 1, panic sets in as their meager $20k savings is instantaneously drained by $15k of fixed costs. By Month 2, they are technically insolvent, holding only $5k against a $15k obligation, which forces them to sell assets at fire-sale prices, tap into high-interest credit cards, or default. By Month 3, they are bankrupt, and the Dollar Army has been defeated.
Now look at the blue line, where the Robust Saver starts with $40k and a burn rate of only $5k/month. After 6 months of zero income, they have spent $30k, yet they still have $10k in the bank, meaning they haven’t even touched their credit cards. When income returns at 50% ($75k/year or $6.25k/month), it is still higher than their fixed costs of $5k/month, so they not only survived the crash but are actually cash-flow positive again, rebuilding their army even at a lower salary.
The more you lock yourself into big monthly bills, the less time you have before things start to fall apart if something goes wrong. Earning a lot doesn’t actually protect you from risk; what really helps is having plenty of cash left over each month. Someone might look rich on paper, but if they’re stretched thin, they’re actually in a fragile spot. Meanwhile, someone with a more modest income but low fixed costs is much more resilient.
Simulation 2: The Opportunity (Wealth Compounding)
Operating leverage doesn’t just hurt you when things go wrong; it also holds you back when things go right. This is the part most high earners miss—they think their high costs are ‘worth it’ because they’ll just earn more later. But if your lifestyle costs go up every time your income goes up, you’re basically running on a treadmill—working hard, but not actually getting anywhere. Let’s simulate two careers starting at age 25 with a $100,000 income. Both individuals are high performers. They both get a 5% raise every single year for 25 years. The investment return is assumed to be a 7% (real return after inflation adjusted of 10% average return). Let’s define our cases:
- Profile A: The Upgrader (Linear Scaling)
- They succumb to Lifestyle Inflation.
- Every time they get a $5,000 raise, they upgrade their lifestyle by $5,000. New car, nicer apartment, better wine.
- They save only what is left over, which remains constant in nominal terms.
- Profile B: The Owner (Banking the Delta)
- They practice “Banking the Delta.”
- Every time they get a $5,000 raise, they save 50% of it ($2,500) and spend the other 50%.
- They still get to enjoy some upgrades in their lifestyle—they’re not missing out or suffering. They’re just not spending every new dollar on more stuff.
We track their “Years to Financial Independence” (FI), defined as the point where their Net Worth is 25x their Annual Expenses (the 4% Rule). To visualize this race, we plot two lines for each profile. The dashed line is the target—the amount they need to be free while the solid line is their actual net worth. Notice that the target line isn’t flat; it acts as a moving goalpost and every time they increase their spending, the dashed line jumps higher, forcing their solid Net Worth line to chase a target that is getting further away.
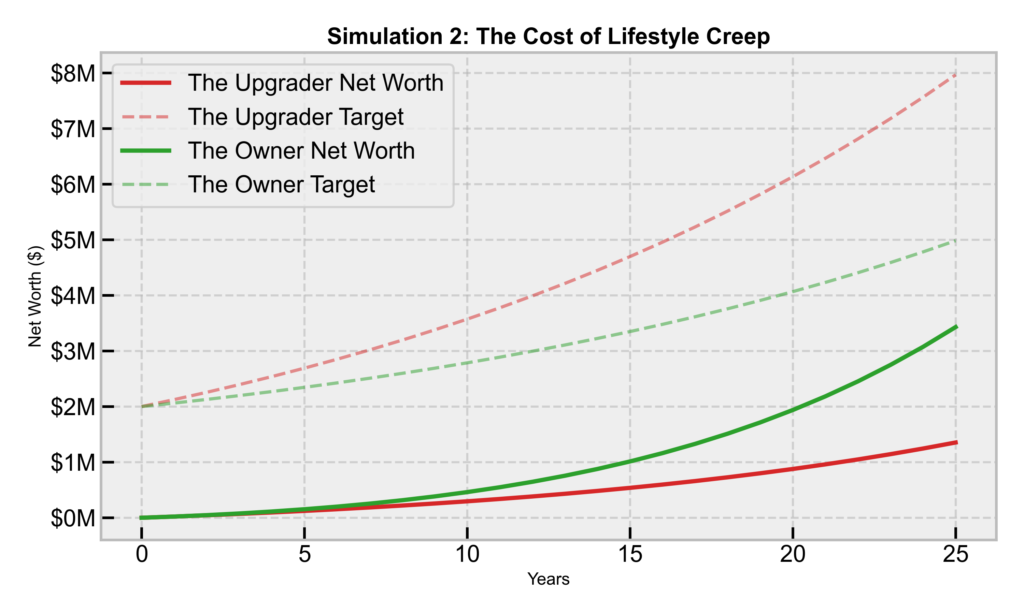
The gap between these two paths might seem unbelievable at first, but it’s really just the math playing out over time. The Owner reaches financial independence at age 43, because by then their army is finally big enough to handle whatever comes up, and they’ve basically won the game. The Upgrader never really gets free. Every time their income goes up, so does the amount they need to save to reach financial independence, because their spending keeps rising too. By the time they’re making over $265,000 a year, they’d need a $6.6 million nest egg just to keep up with their lifestyle. They end up stuck, unable to take a break, switch to a more meaningful job, or try something new, because their own spending has boxed them in.
The Diderot Effect
It seems like the math should be simple, so why do so many smart people end up caught in this cycle? I think the answer has a lot to do with something called the Diderot Effect. Denis Diderot, who was a French philosopher, spent most of his life without much money, but everything changed when someone gave him a beautiful robe. Suddenly, his old rug looked out of place next to the new robe, so he swapped it out for a nicer one, and then the chair looked shabby next to the new rug, so he replaced that too. One thing led to another, and before long, he had replaced almost everything he owned, only to find himself in debt. Diderot himself put it best: “I was the absolute master of my old robe, but I have become a slave to my new one.” I see this same pattern play out all the time, especially among people who start earning more. You get a promotion, which feels like your own version of the new robe, and maybe you celebrate by buying a Tesla, which is your new rug. But then the Tesla looks out of place in the driveway of a rental, so you start looking for a house, and once you have the house, it seems like you need the right kind of furniture to match. Pretty soon, you notice that the neighborhood has its own expectations for vacations and private schools, and what started as a $20,000 raise somehow turns into $50,000 of new expenses every year. It’s surprisingly easy to upgrade your way into a situation that feels a lot less secure than you expected.
Ambition Consumption
Sometimes, when you look at the Retire Early community, it can feel like there’s this idea floating around that high earners are somehow the villains, or that the only way to reach financial freedom is to live in a van and eat lentils every day, but I don’t think that’s true at all, because that kind of thinking comes from a place of scarcity. The way I see it, your income is really just the fuel for your financial journey, so it makes sense to go after promotions, negotiate for better pay, build side projects, and set your sights high, whether that means earning $500,000 a year or even more. Earning a high income can solve a lot of problems, because it speeds up the part of the process where you’re building up your savings and investments. For example, if you save half of $50,000, you end up with $25,000, but if you save half of $500,000, you suddenly have $250,000, so the math is pretty clear. The real challenge, though, is to keep your ambition and drive focused on earning, while making sure your day-to-day spending doesn’t creep up alongside it, because the real win is when you have a high income but your regular expenses stay low. With that in mind, here are a few different combinations you might see:
- If you have a high income but also spend a lot, you end up in a pretty fragile spot, kind of like what I’d call the Levered Professional.
- On the other hand, if your income is low but your spending is also low, you’re stable, but you might feel a bit stuck, which is a bit like the Van Dweller approach.
- But if you can manage to keep your spending low while your income is high, you end up in a really strong position, which is where real wealth starts to build up.
The real magic happens when you can earn like a big, complicated business while still keeping things as simple and low-cost as possible, because that’s the combination where wealth really starts to grow. There’s also a quieter, often overlooked benefit to keeping your operating leverage low: it gives you options. When your finances are strong and your solvency ratio is high, you suddenly have the freedom to make choices that aren’t just about chasing the next paycheck, but could actually set you up for much bigger wins down the road. Maybe that means you feel comfortable taking a risk, like leaving a steady job to join a startup for equity, or maybe it means you can confidently turn down a project that doesn’t feel right, knowing you’re not desperate for next month’s salary. Oddly enough, this kind of freedom can actually make you more valuable at work, since you’re not afraid to stand your ground. And when the market takes a dive and people who are stretched thin have to sell their investments just to cover their bills, you’re in a position to buy instead. So, having strong cash flow isn’t just about protecting yourself from bad times—it’s actually one of the best ways to put yourself in a position to win.
Conclusion
If you’ve ever wondered how resilient your household really is, it can help to look beyond your net worth, since that number sometimes gives a false sense of security, especially when most of it is tied up in things you can’t quickly turn into cash, like your home or company shares. Instead, you might want to spend a few minutes exploring your Personal Operating Leverage, which is just a way of seeing how much breathing room you have each month. Start by adding up all the bills you absolutely have to pay each month—things like rent or mortgage, taxes if they aren’t already taken out, minimum debt payments, insurance, average utilities, and the basics for groceries. Once you have that total, you can figure out your solvency ratio by dividing your monthly take-home pay by the must-pay number you just calculated.
If your ratio is close to 1.0 or below, you’re basically walking a tightrope without a safety net—you’re working for your bank, not for yourself. If it’s 1.5, you’re stable. If it’s 2.0 or higher, you’re building a fortress, and you have the freedom to take risks, quit a toxic job, or buy assets when others are forced to sell.
The goal is to have enough space in your budget that your money can start working toward your future, instead of just covering last month’s expenses.
References
- “Bankruptcy Filings Rise 16 Percent,” United States Courts, 2024. [Online]. Available: https://www.uscourts.gov/news/2024/04/25/bankruptcy-filings-rise-16-percent
- “The cost of lifestyle creep,” Wealthy Parrot, 2024.
- “Operating Leverage,” Corporate Finance Institute, 2024.
- “Hedonic Adaptation,” Investopedia, 2024.

Leave a Reply